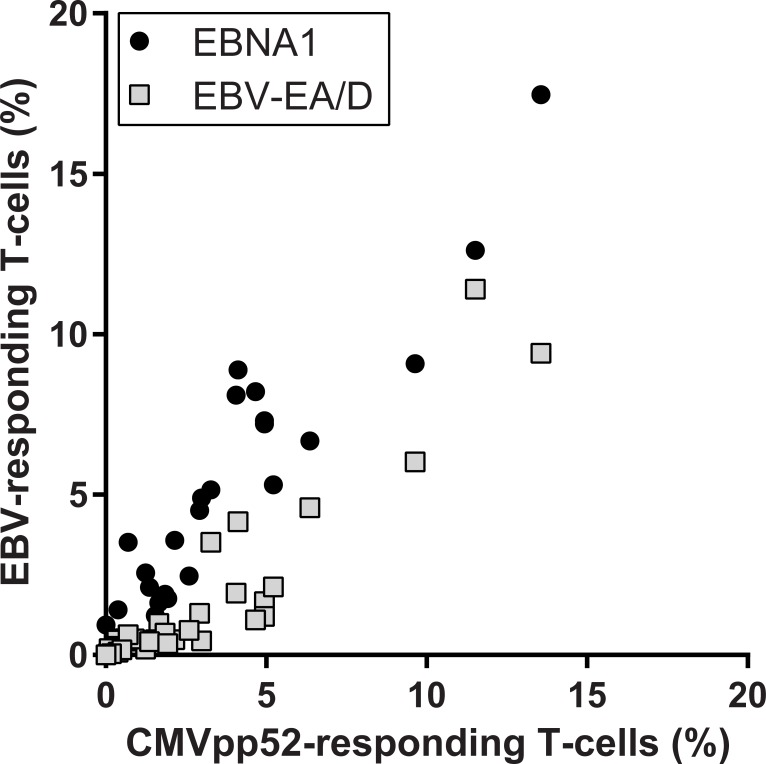
Fig 3. Correlation analyses of associations between percentages of CMVpp52-responding and EBNA1- or EBV-EA/D-responding T-cells, respectively (CD69-expressing T-cells upon antigen stimulation).
Spearman’s correlation coefficients (r) are 0.933 (p<0.0001) and 0.917 (p<0.0001) when correlating percentages of CMVpp52-specific T-cells with EBNA1- (●) or EBV-EA/D-responding (□) T-cells, respectively.

