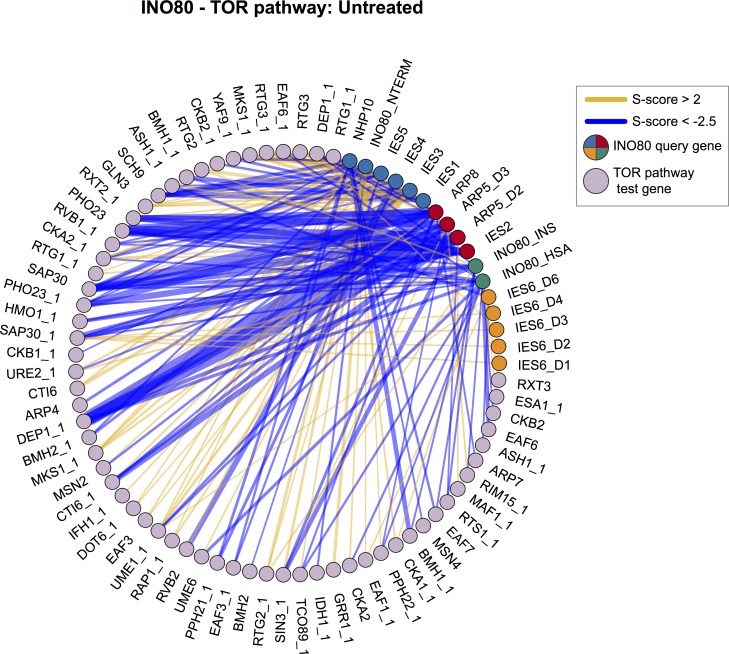
Fig 6. INO80 and the TOR pathway have a highly connected genetic interaction network.
Genetic interaction network between INO80 subunit query strains and significantly interacting TOR pathway test strains in the untreated static condition. Line width indicates strength of S-score, INO80 queries are colored according to modules identified in Fig 2. Network density is significantly high, p-value = 1.1e-3 by Monte Carlo randomization test.

