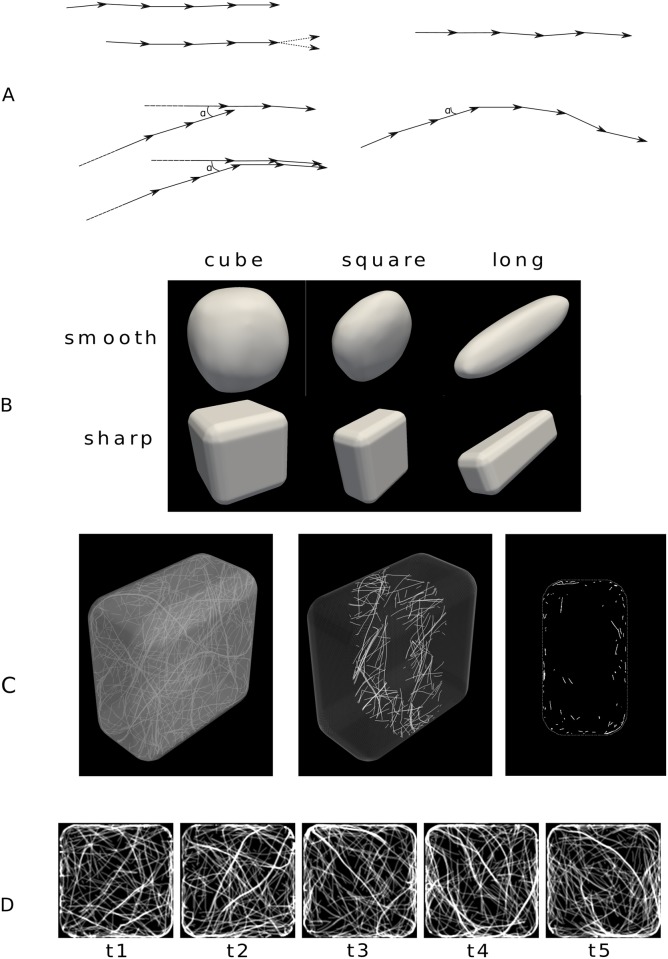
Fig 1. Shapes of simulated cells.
(A) Top left: Two time steps of a simulation when the microtubule grows freely inside the cell and simultaneously shrinks from the minus end; at the plus side (arrowhead), the new vector is calculated by adding a small random deviation to the previous vector. Bottom left: Example of a zippering process—When the new microtubule encounters an existing one at a shallow angle (if the angle a is smaller than threshold α), the new direction of the vectors follows that of the leading microtubule; a steep angle would lead to plus end shrinkage. Top right: Strong anchoring to the plasma membrane—The microtubule grows tangentially to the local plane. Bottom right: Weak anchoring to the membrane—When the microtubule encounters the membrane at a shallow angle (a < α), it continues tangentially until the random deviation leads it to leave the membrane. (B) Shapes of the envelope of the cell: cube, “square”, and “elongated”. First row: smooth shapes. Second row: sharp shapes. Scales are not respected. (C,D) Example of a simulation in a sharp square with weak anchoring and default parameters (see Methods); the length of the simulation is 50000 timesteps, corresponding to approximately 100 minutes, also see S2 Video. (C) Snapshot showing all microtubules (left), microtubules located in a central slice that is ∼2.4μm-thick (center), and the projection of this slice in 2D (right). (D) Snapshots taken after 10000 timesteps intervals (∼20 min); the pictures show a confocal microscopy-like z-projection (see Methods).

