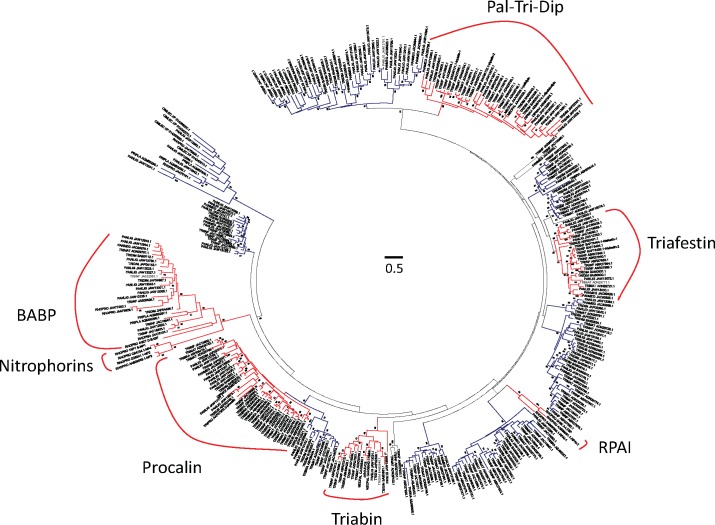
Fig 2. Phylogram of the lipocalin family proteins from P. lignarius and their best matches.
The optimal tree with the sum of branch length = 123.81570372 is shown. The tree is drawn to scale, with branch lengths in the same units as those of the evolutionary distances used to infer the phylogenetic tree. The bar at the center of the graph indicates a value of 0.5. The analysis involved 330 amino acid sequences. All ambiguous positions were removed for each sequence pair. There were a total of 423 positions in the final dataset. The values near the branches represent the percentage of bootstrap support. Values below 50% are not shown. For more details, see Material and Methods.

