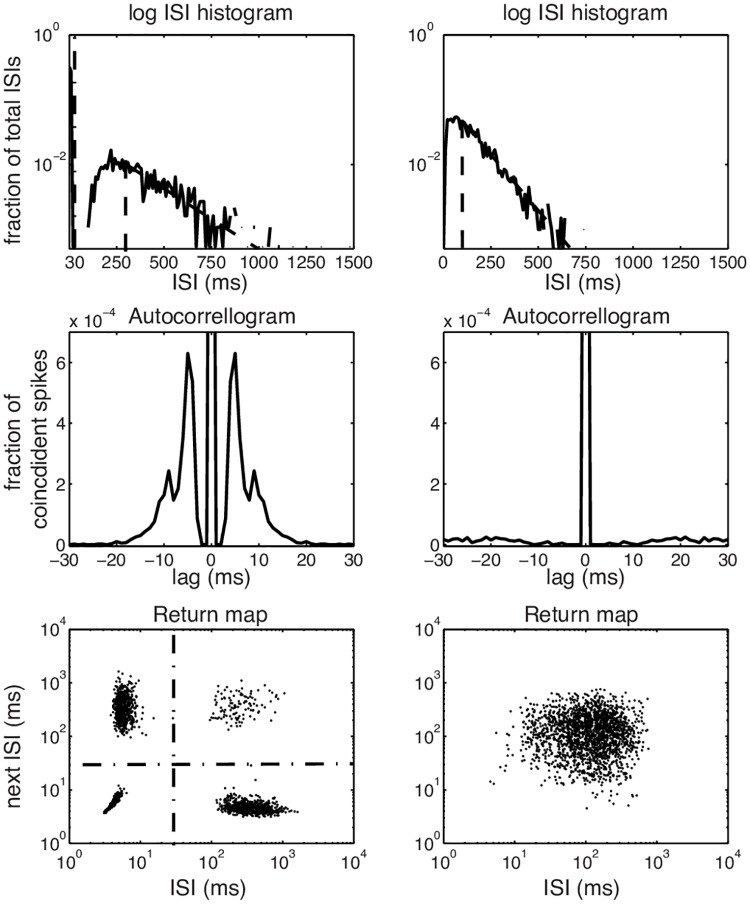
Fig 2. Quantification of burstiness in a TCR cell spike train.
Left panels: Spike train recorded at a membrane state of −80 mV. The ISI histogram (top row) shows a first peak around 5 ms and a second one around 250 ms. The tail decays exponential (dashed line) above 300 ms; so events were considered independent if further apart than 300 ms. The Autocorrelogram (middle row) shows peaks at 5 and 10 ms. In the return map (bottom row) ISI n is plotted against ISI n+1; k-means clustering of this data provides 4 clusters and a silhouette value of 0.96. Based on the ISI histogram and the return map we used an interval of 30 ms to separate single spikes from bursts. Right: Spike train recorded at a membrane state of −50 mV. The ISI histogram (top row) indicates a single Poisson process with events independent if they were further apart than 100 ms. The autocorrelogram (middle) shows only one central peak around zero and the return map (bottom) shows an unimodal structure confirmed by a silhouette value of 0.48.

