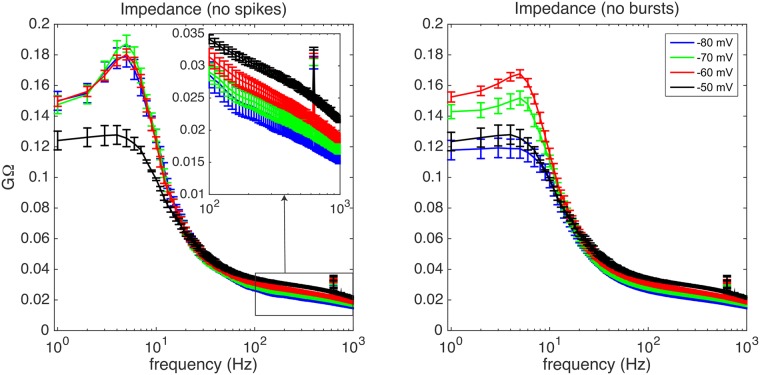
Fig 3. Transfer function of a TCR neuron in vitro.
Impedance of the TCR neuron calculated as the amplitude of the transfer function between current input and voltage output for the four defined membrane states (blue: −80 mV, green: −70 mV, red: −60 mV, black: −50 mV). Left: A small time window was cut out and interpolated around each single spike to avoid contamination of the spectra by the fast spikes. Inset: zoom with one in ten data points on the frequency range between 100 and 1000 Hz. Right: same data, but now with also a larger cut-out window around each burst including the LTS. Note the resonance peak around 5 Hz that is related to bursting: absent in the −50 mV trace and considerably reduced if we cut away the LTSs in the left panel. Error bars reflect standard error of the mean.

