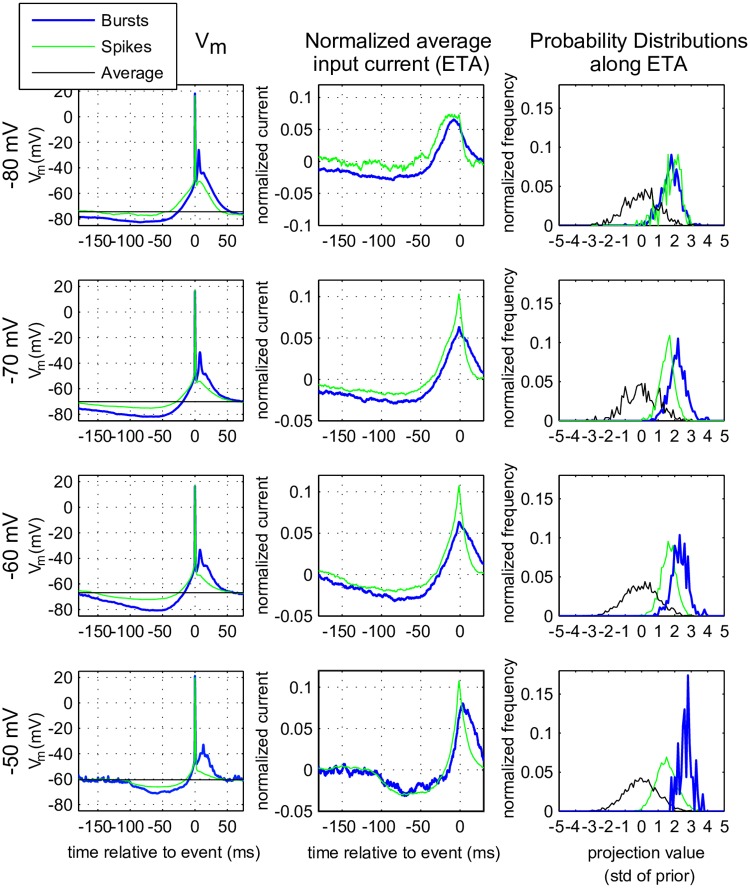
Fig 6. Event Triggering Average (ETA) of membrane potential and injected current.
Left column: ETA of the membrane potential 200 ms preceeding single spikes (green),aligned at t = 0, or bursts (blue). The peak of the spike (or first spike in the burst) was used as trigger; this implies perfect coincidence of isolated spike and first spike in the burst; later spikes in the burst tend to average out. The horizontal black lines indicate the mean value of the subthreshold membrane potential calculated from the entire trial. Middle column: ETA of the input current (mean value substracted and normalized with the L2 norm) using the triggerpoints from the voltage (peak of the spikes, left column). Right column: probability distributions of a convolution of the normalized ETA with event-triggered (blue/green lines) or with a random input (black line, also called the prior). Rows indicate membrane states.

