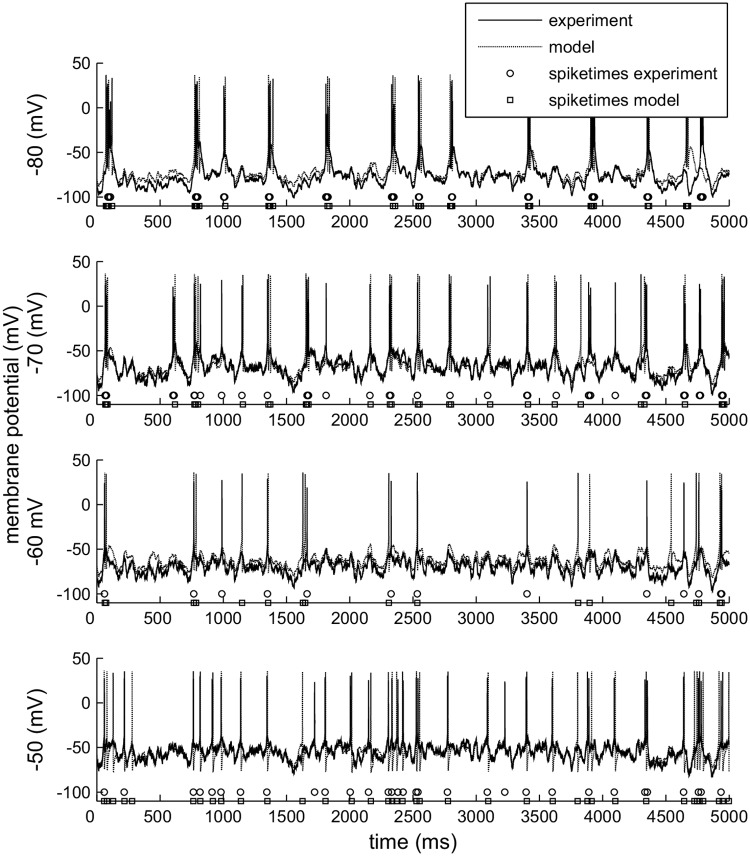
Fig 9. Comparing experimental and model spike trains.
The same computer generated frozen noise was injected into the TCR cell (solid line) and in the fine tuned model cell (dotted line). This generated comparable spike trains consisting of isolated spikes and burst in a state dependent way (rows represent the four membrane states. Open circles indicate the timepoints at which the TCR cell fired, while squares mark the moments where the model cell fired, either a spike or a burst.

