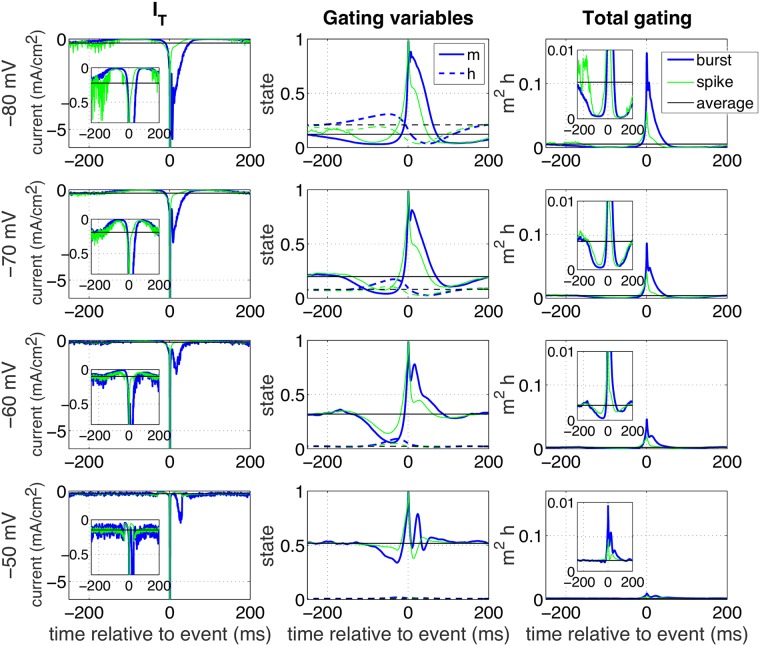
Fig 11. Event-triggered T-type calcium current.
Event-triggered T-type calcium currents were calculated for the model (first column) comparable to the experimental ETAs in Fig 6; t = 0 indicates the peak of the (first) spike. Rows indicate the four different membrane states; blue traces indicate the current when a burst was induced, while green traces depict the situation for an isolated spike. The horizontal black line gives the mean value in the steady state condition. The inset zooms in around the time of initiation. The second column depicts the gating variables m (solid) and h (dashed) that underly the current using the same color code. The third column illustrates the total gating (the product m2h) that underlies the current.

