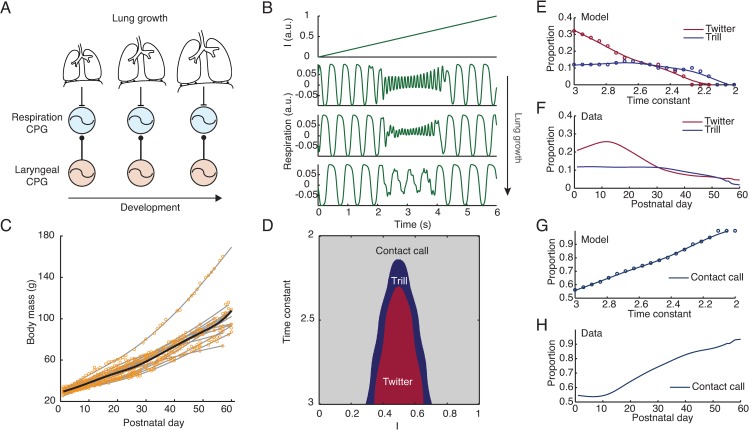
Fig 3. Simulated lung’s growth reproduces the developmental trajectories of call proportions.
(A) Illustration of the impact of the lung’s growth on the respiratory CPG. (B) Simulated respiratory activity under ramping input with decreasing values of the time constant. Fast respiratory patterns diminish as time constant decreases. From top to bottom: γ1 = 3.4, 3.1, 2.8. (C) Body mass growth versus postnatal days (n = 13). Points are data, grey lines are cubic spline–fitted data, and black line is the mean body mass over time. (D) Diagram of different call types, classified by duration, in the parameter space of time constant and drive I. (E) Simulated twitter and trill proportions based on the areas in (D) at different time constants. (F) Averaged twitter and trill proportions from data (n = 13). (G) Simulated contact call proportions based on the area in (D). (H) Averaged contact call proportions from data (n = 13). MATLAB code is available for panels B, D, E, and G in S2 Code. CPG, central pattern generator.

