
Figure 1. Effect of Combination treatment on Hep3B cell viability, apoptosis and cell migration.
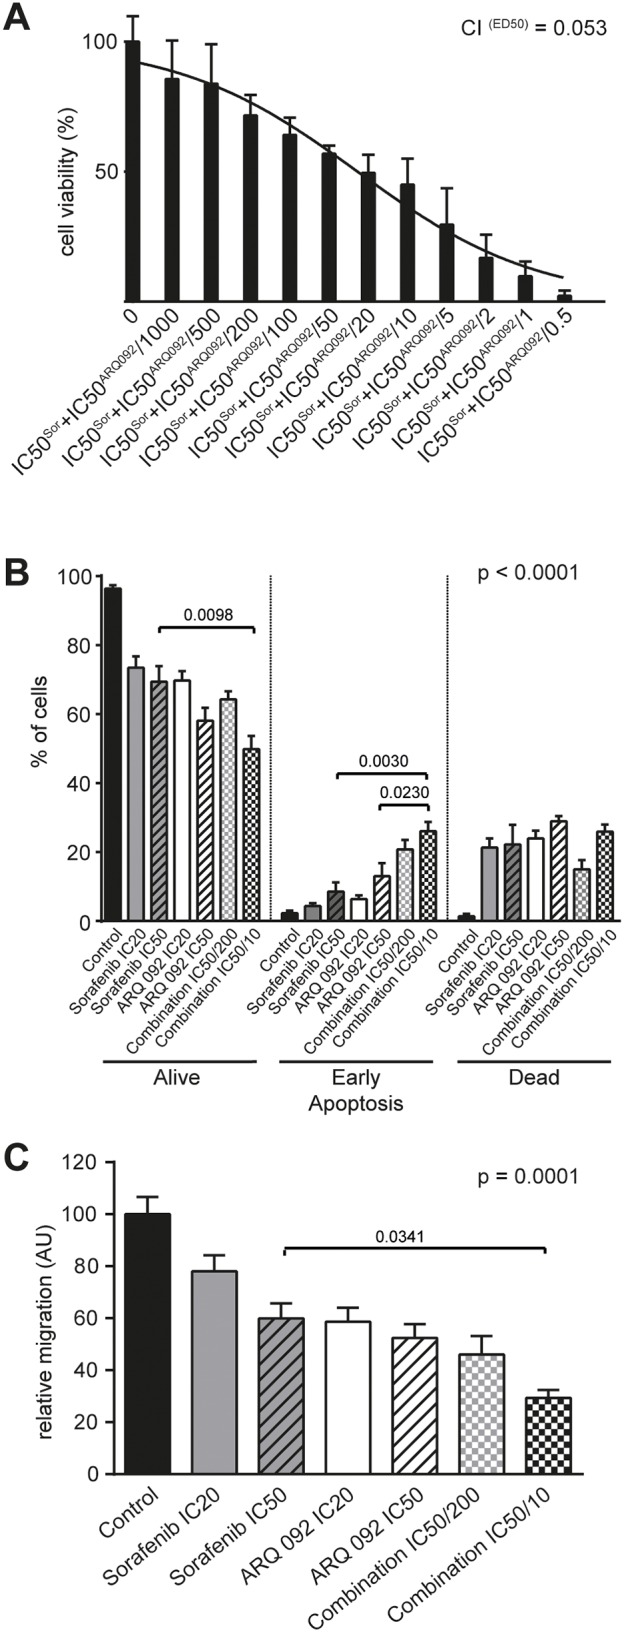
(A) MTT assay on Hep3B cell line after 48h of treatments showing significant decrease in cell viability with increasing concentrations of combination treatment of ARQ 092 and sorafenib (constant ratio IC50: IC50). Combination index (CI = 0.053) at effective dose 50 (ED50) revealed strong synergy. (B) Additive effects of combination treatment of ARQ 092 and sorafenib on apoptosis in Hep3B after 48h of exposure. P values in graph represent ANOVA comparison of ARQ 092 IC50, sorafenib IC50 and Combination IC50/10. P value of ANOVA test of all groups is indicated in the corner of the graph (p <0.0001). (C) The quantification of migration (decrease of width of the wound after 24h) in Hep3B. Additive effects of combination treatment of ARQ 092 and sorafenib. P values in graph represent ANOVA comparison of ARQ 092 IC50, sorafenib IC50 and Combination I IC50/10. P value of ANOVA test of all groups is indicated in the corner of the graph (p =0.0001). Control was set as 100%, values are means ± SE from three independent experiments performed in triplicates (A) and in duplicates (B, C).