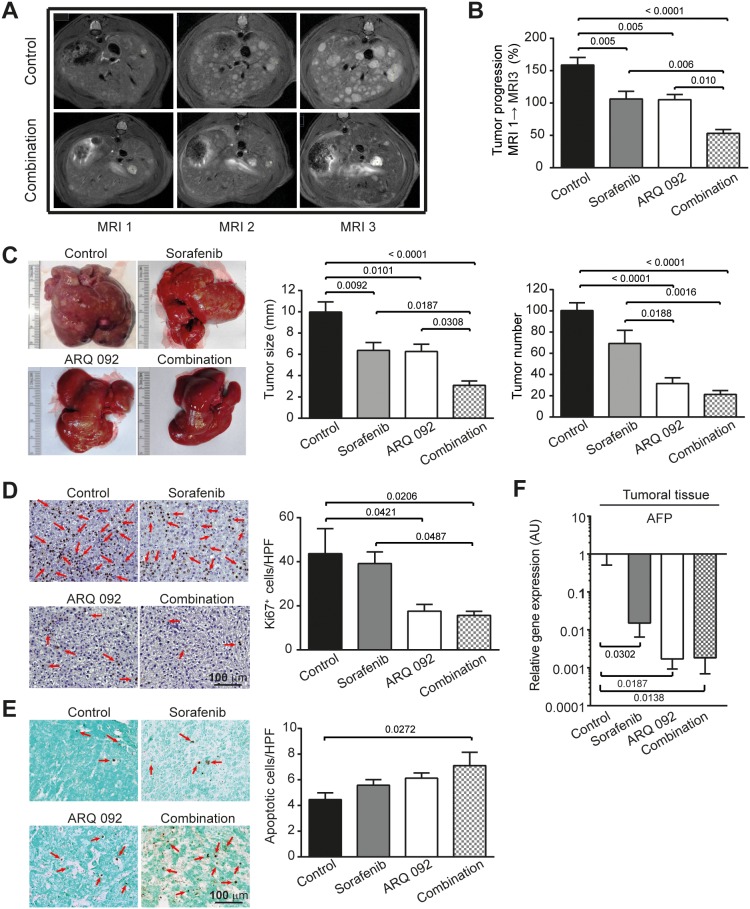
Figure 2. Anti-tumor effect of combination treatment.
(A) Representative pictures of abdominal MRI 1, 2 and 3 scan of non-treated rat and rat treated by combination treatment. (B) Tumor progression assessment by comparison of tumor size on MRI 1, 2 and 3 in Control, sorafenib, ARQ 092 and Combination group. (C) Macroscopic examination of livers with assessment of tumor size (middle panel) and tumor number at the surface of livers (right panel). (D) Representative images of nuclear Ki67 staining (arrow), 20x magnification with quantification of Ki67 staining per high power field (HPF). (E) Representative images of apoptosis induction (right panel) determined by TUNEL immunostaining (arrow), 20x magnification with quantification of apoptotic cells per HPF. (F) qPCR analysis of alpha fetoprotein (AFP) gene expression in tumor liver samples. The scale of the Y axes are Log 10, control was set as 1, values are means ± SE, n=7/group. Comparison of means was done by ANOVA test with Tukey correction.

