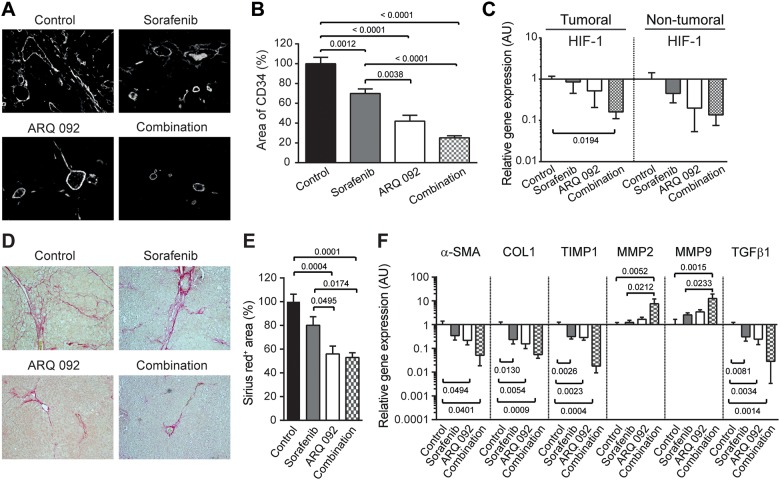
Figure 3. Effect of Combination treatment on tumor vascularization and liver fibrosis.
(A) Representative pictures of CD34 immunofluorescence staining of liver tissue. (B) Quantification of CD34 staining, control was set as 100, values are means ± SE. (C) qPCR analysis of Hypoxia-inducible factor (HIF)-1 gene expression in tumoral and non-tumoral liver samples. Control was set as 1. Values are means ± SE. N=7/group. Comparison of means was done by ANOVA test with Tukey correction. (D) Representative histological images of livers stained with Sirius red. (E) Quantification of Sirius red staining area per total area; control was set as 100 %. (F) qPCR analysis of alpha smooth muscle actin (α-SMA), Collagen (COL)1, TIMP Metallopeptidase Inhibitor 1 (TIMP1), Matrix metalloproteinase-2 (MMP2), Matrix metalloproteinase-9 (MMP9) and transforming growth factor (TGF)β gene expression in non-tumoral liver tissue. The scale of the Y axes are Log 10, control was set as 1. Values are means ± SE. N=7/group. Comparison of means was done by ANOVA test with Tukey correction.

