
Figure 4. Effect of Combination treatment on AKT and ERK pathways.
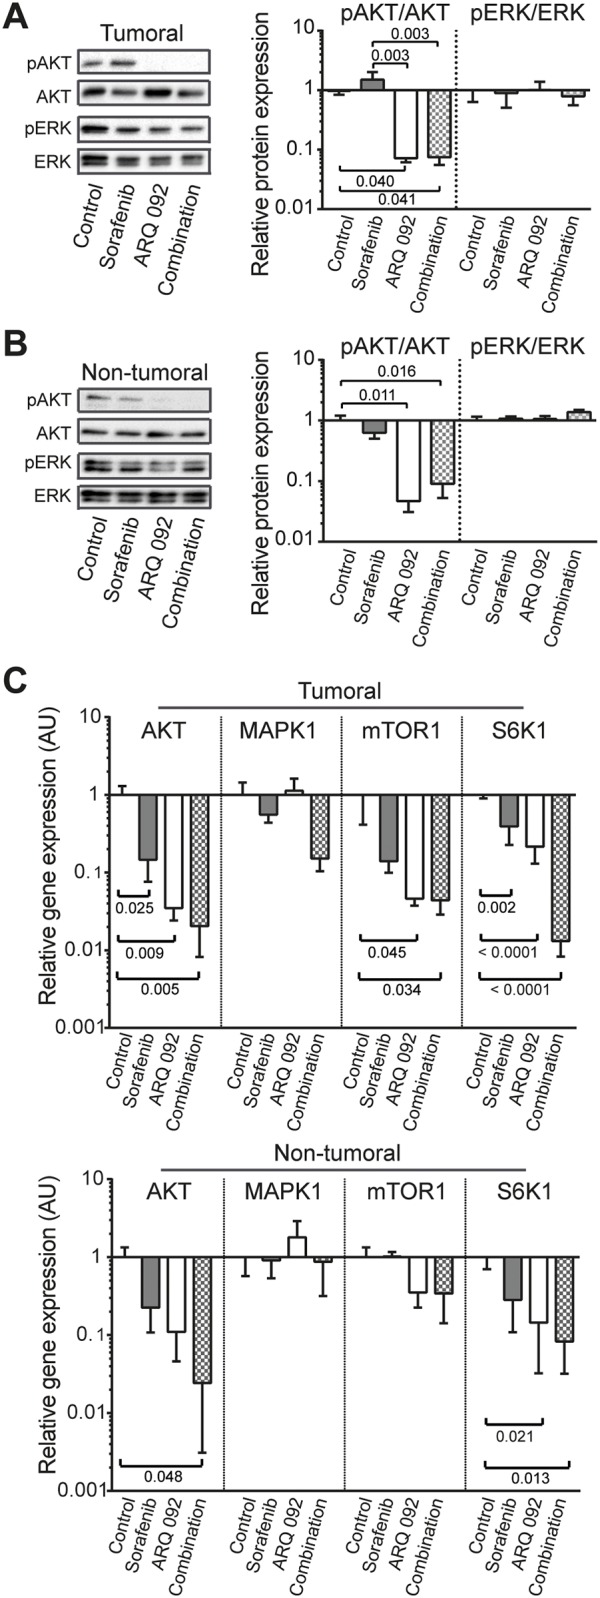
Western blot analysis of pAKT/AKT and pERK/ERK in (A) tumoral and (B) non-tumoral liver tissue. pAKT and pERK were stained first and after development, the membranes were stripped followed by staining of AKT and ERK. (C) qPCR analysis of the expression of AKT, MAPK, mTOR, S6K1 in tumoral (upper panel) and non-tumoral (lower panel) liver tissue. The scale of the Y axes are Log 10, control was set as 1, values are means ± SE. N=7/group. Comparison of means was done by ANOVA test with Tukey correction.