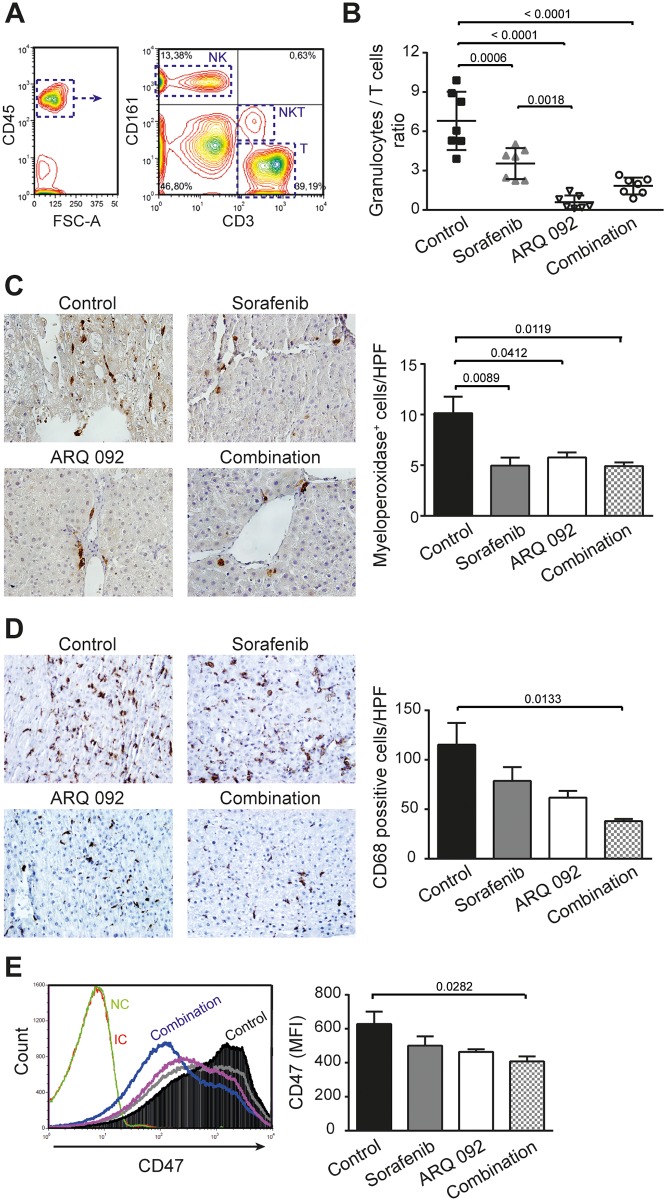
Figure 5. Effect of combination treatment on immune system and tumor microenvironment.
(A) Gating flow cytometry strategy to investigate immune cells. Lymphocytes were first identified according their FSC and SSC parameters and further gated based on their CD45+ expression. Among the CD45+ population, NK (CD161high+CD3-), NKT (CD161low+CD3+) and T (CD161-CD3+) cells were selected. (B) Granulocytes to lymphocytes ratio. Values are means ± SE. N=7/group. Comparison of means was done by ANOVA test with Tukey correction. (C) Representative histological images of livers stained with myeloperoxidase and the quantification of positive cells (neutrophils) per high power field (HPF). (D) Representative histological images of livers stained with CD68 and the quantification of positive cells (macrophages) per HPF. (E) Expression of CD47 in tumor liver tissue and quantification of mean fluorescence intensity (MFI) of CD47, sorafenib (grey line), ARQ 092 (purple line). Values are means ± SE. N=7/group. Comparison of means was done by ANOVA test with Tukey correction.

