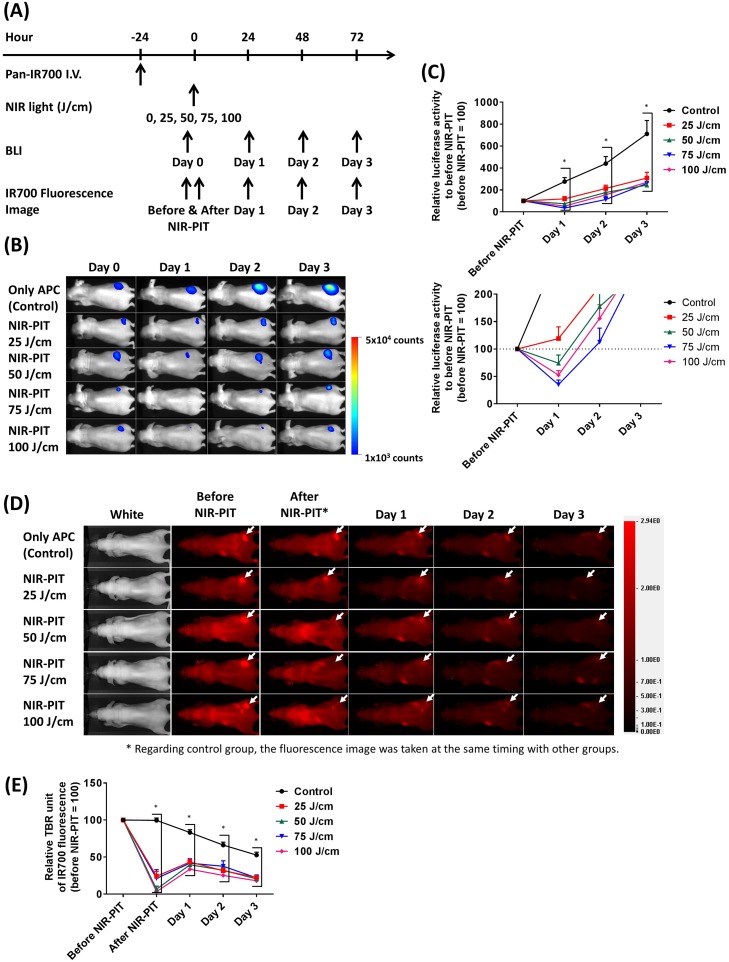
Figure 4. Estimation of interstitial NIR light dose needed for successful NIR-PIT treatment.
(A) NIR-PIT regimen. Both bioluminescence and IR700 fluorescence images were obtained at each time point as indicated. (B) Bioluminescence images in response to NIR light dose. The control group gradually increased luciferase activity due to tumor growth, but NIR-PIT groups exhibited marked decrease in BLI. (C) BLI before and after NIR-PIT. Although NIR-PIT groups showed significantly differences with the control group, NIR light more than 50 J/cm were needed to significantly decrease the activity compared to before NIR-PIT. However, all activities were increased at 2 days after treatment (n = at least 7; *, P < 0.05 vs. control). (D) IR700 fluorescence images of control and NIR-PIT groups. White arrows indicate tumors. Although IR700 fluorescence was strongly decreased after 25 J/cm or more NIR light irradiation only modest changes in tumor were seen with only 25 J/cm. (E) IR700 fluorescence intensities were significantly decreased immediately after NIR-PIT with 25 J/cm or more NIR light dose (n = at least 7; *, P < 0.05 vs. control). Although the intensities increased at 1 day after NIR-PIT, they afterward decreased as well as the control group.

