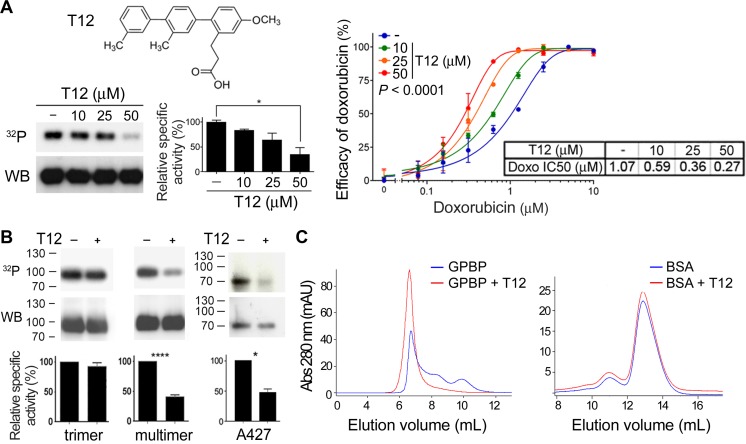
Figure 5. T12, a peptidomimetic of the GPBP region comprising 260SHCIE264 motif disturbs multimerization.
(A) Chemical structure of T12 and dose-response effects on GPBP autophosphorylation and A549 doxorubicin IC50. Phosphorylation mixtures were analyzed by sodium dodecyl sulfate polyacrylamide gel electrophoresis (SDS-PAGE), blotted and exposed (32P) prior to detect GPBP with N27 (WB). Specific activities (histogram) were calculated using WCIF ImageJ and represented as percentage (mean ± standard error of the mean, SEM) of control mixture (−) that was set at 100%. Statistics: 1WA and Fisher’s (1WA-F), n = 2. Graph and Table show the efficacy and IC50 of doxorubicin on A549 cultures at the indicated T12 concentrations. Efficacy values are mean ± SD. The 2WA and Tukey’s (2WA-T) and IC50 are indicated, n = 4. Representative of five assays. (B) Recombinant (multimer or trimer, n = 3) or extracellular native (A427, n = 2) GPBP were analyzed as in A at 50 µM T12. Statistics: Student’s t-test. (C) Similar amounts (125 μg) of recombinant extracellular GPBP and bovine serum albumin (BSA) were exposed to T12 (10 mM) during 15 min at room temperature and further FPLC-SEC analyzed essentially as in previous Figure. Represented is one out of three independent analysis performed from two different GPBP preparations.

