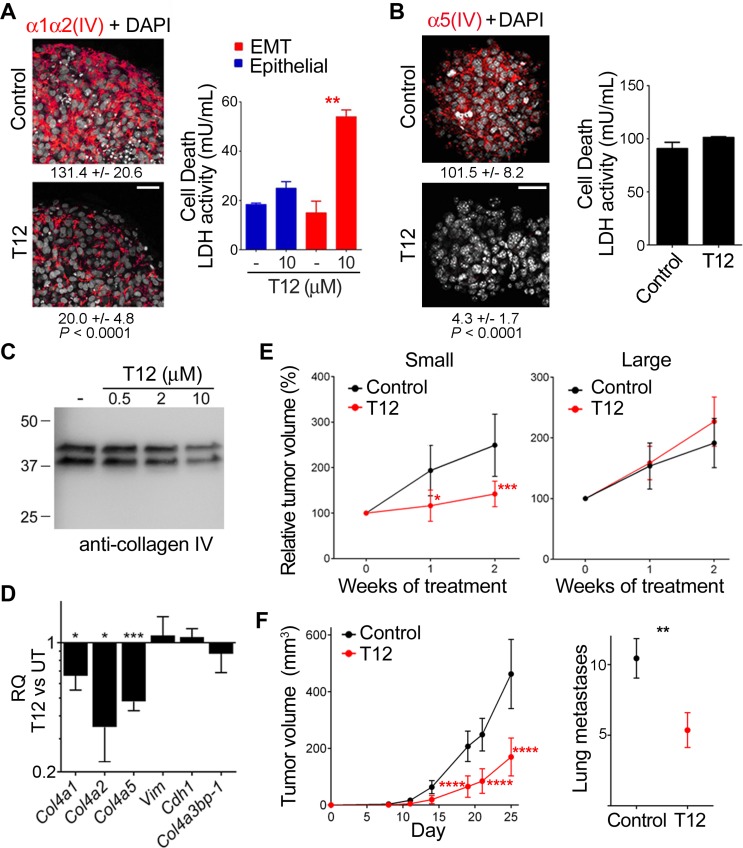
Figure 7. T12 impairs mesh collagen IV formation and reduces tumor burden in mouse models.
(A) TαTβ-stimulated A549 and (B) A7C11 spheroids were treated (48 h) and analyzed by IF-CM to visualize the indicated polypeptides (images) and cell death measured as in Figure 2C and represented with bars (histograms). Statistics: Student’s t-test, n = 3 (A) n = 2 (B). Indicated are FI measured, expressed and compared as in Figure 1 Statistics: Student’s t-test. (C) The extracellular matrix of A7C11 spheroids subjected to the indicated treatments (48 h) was collagenase digested and analyzed by WB using mAb 202. (D) The RQ of the indicated mRNA in treated (10 µM, 36 h) A7C11 spheroids (T12) vs untreated (UT) is represented as in previous figures. Statistics: Student’s t-test, n = 2. (E) A549 mouse-model bearing the indicated xenografts was untreated (Control) or treated (T12) and the indicated variable determined over time and plotted (mean ± 95% confidence interval, CI). Tumor volume at treatment initiation was set to 100%. Statistics: 2WA-S, n = 15. (F) Plotted are indicated variables (mean± 95% CI) in 4T1 mouse-model untreated (Control) or treated (T12) over time (left) or at day-25 (right). Statistics: Left, 2WA-S, n = 10. Representative of three assays. Right, Student’s t-test, n = 30.

