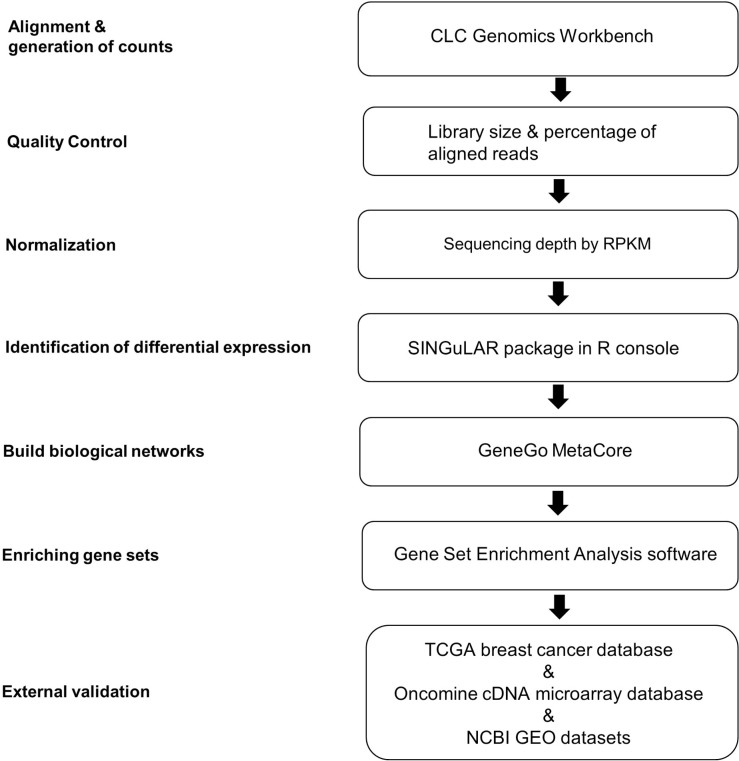
Figure 1. Analytical strategies of scRNA-seq library database.
A flow chart of the steps in analysis of scRNA-seq data from single ECs is shown. The analysis steps are listed on the left. The computational biology toolsets used for the steps are listed in the boxes. RPKM, reads per kilobase of transcript per million mapped reads; TCGA, The Cancer Genome Atlas.

