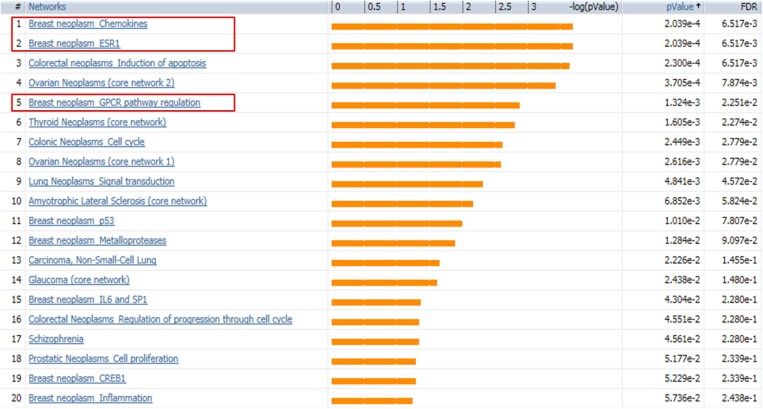
Figure 5. MetaCore disease biomarker analysis indicates the differentially expressed genes are correlated with breast cancer.
Genetic co-morbidity analysis indicated three of the top five disease annotations are breast neoplasm chemokines, breast neoplasm ESR1 and breast neoplasm GPCR pathway regulation. Orange bars represent the significance of difference by negative logical p value. p values and FDR values are listed on the right.

