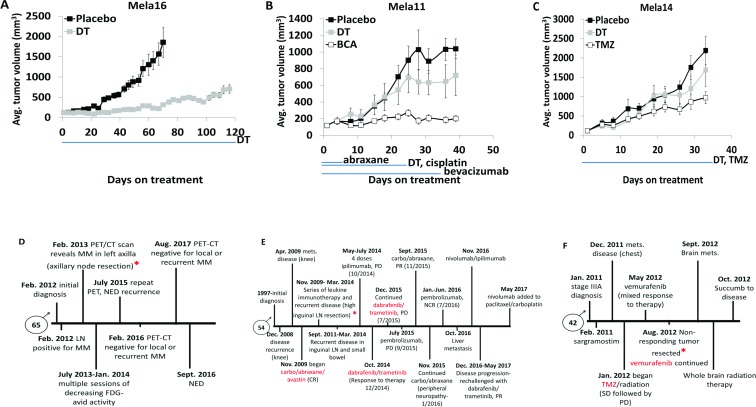
Figure 3. Matched PDTX models show common therapeutic responses to that of the matched patient.
(A–C) Mice bearing subcutaneous tumors were dosed as indicated with vehicle (n = 10, Mela14 and Mela16; n = 8, Mela11), or combination of (25 mg/kg) dabrafenib and (1 mg/kg) trametinib (n = 10, Mela14 and Mela16; n = 8, Mela11). Both dabrafenib and trametinib were dosed (once daily by mouth). Each in vivo model had a distinct response to treatment, ranging in the order of most sensitive to least sensitive (p-values for Mela16, Mela11, and Mela14, are p < 0.05, p = 0.92, and p = 0.97, respectively, when compared to no treatment). (B-C) Mice were also dosed with similar targeted therapy as the respective patient from which the PDTX model was derived. (B) Mice were dosed with the combination of (5 mg/kg) bevacizumab, (8 mg/kg) cisplatin, and (20 mg/kg) abraxane. Bevacizumab was dosed (biwk x 5, ip), cisplatin was dosed (qwk × 3, ip), and abraxane was dosed (qod x 5, iv). (Wilcoxon rank sum test; p < 0.05 vs. no treatment). (C) Mice were dosed with (100 mg/kg) TMZ (qd x 5, po). (Wilcoxon rank sum test; p = 0.52 vs. no treatment). Red asterisks denotes when tumors were received for development of corresponding PDTX mouse models. The blue line below the x-axis indicates dosing (Rx) period in all studies. The y-axis is mean tumor volume ± SEM. (D–F) Patient clinical history for disease treatment. A, PDTX drugs were compared to those highlighted in red. b, TMZ, temozolomide; Mets, metastasis; LN, lymph node; Carbo, carboplatin; SLNB, sentinel lymph node biopsy; MM, metastatic melanoma; PET/CT, positron emission tomography-computerized tomography; FDG, fludeoxyglucose; NED, no evidence of disease; DT, dabrafenib+trametinib; BCA, bevacizumab+cisplatin+abraxane; CR, complete response; PD, progressive disease; PR, partial response; NCR, near complete response; SD, stable disease.

