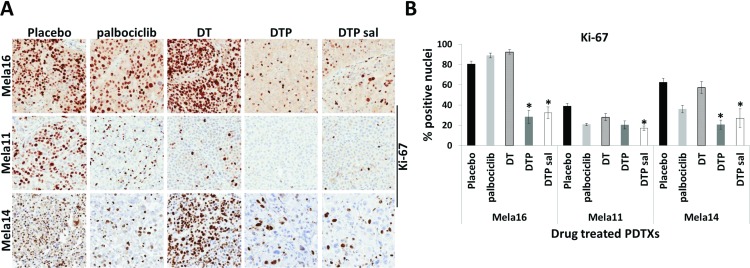
Figure 5. Changes in Ki-67 protein expression among treatment groups.
(A) Representative images from endpoint tumors of Ki-67 immunohistochemical staining in placebo control (n = 10) and therapy treated tumors (n = 10). Magnifications are 20×. (B) Quantitative analysis of Ki-67 staining. The percentage of nuclear positive tumor cells were quantitated for placebo and drug treated groups using Aperio Eslide Manager (Leica biosystems). Data are presented as the mean ± SEM. Statistical analyses are compared between DT and DTP± salvage therapy. Mean values were compared using Wilcoxon rank sum test, p < 0.05. a, DT, dabrafenib + trametinib; DTP, dabrafenib + trametinib + palbociclib; sal, salvage.

