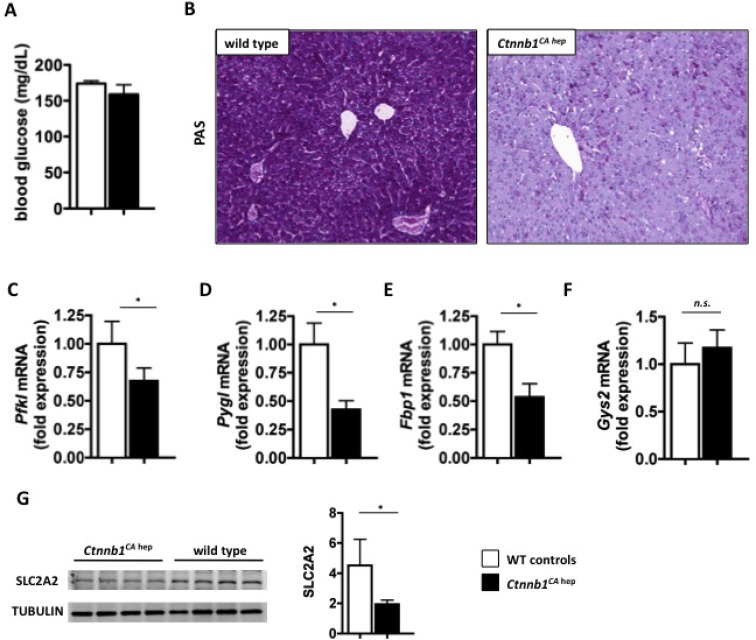
Figure 5. Ctnnb1CA hep mice display severe disturbances in carbohydrate metabolism.
No difference in blood glucose levels between Ctnnb1CA hep and WT littermates was detectable (A). PAS staining shows severely decreased levels of glycogen in Ctnnb1CA hep mice (B). mRNA levels of key enzymes in glucose metabolism including Phosphofructokinase (Pfkl, C), liver specific glycogen phosphorylase (Pygl, D) and fructose 1,6-bisphosphatase (Fbp1, E) were significantly down-regulated in livers of Ctnnb1CA hep mice. Glycogen synthase 2 (Gys2, F) was not deregulated on mRNA level. Western blot analysis revealed down-regulation of main glucose transporter GLUT2 (SLC2A2) in livers of Ctnnb1CA hep mice compared to WT controls (G).

