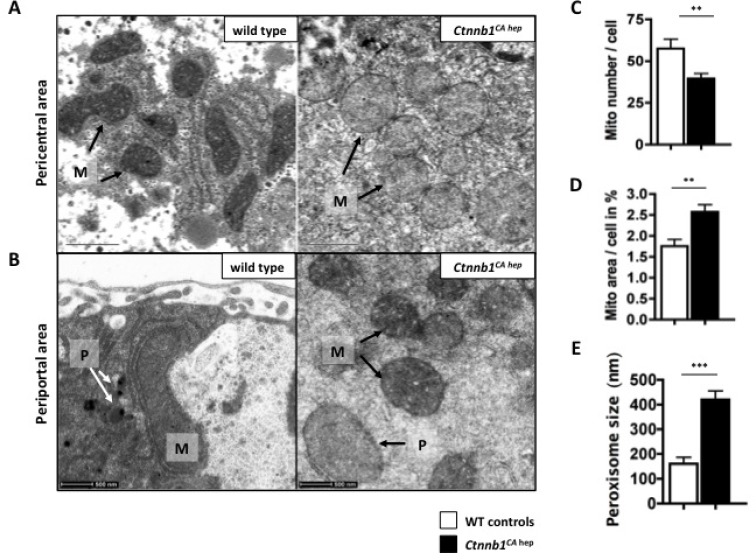
Figure 6. Ctnnb1CA hep mice have a mitochondrial phenotype.
Mitochondria (M) of Ctnnb1CA hep mice display a pathological phenotype shown by electron microscopic imaging. Especially around the central veins mitochondria are swollen with a rounded shape (A). Number of mitochondria per hepatocyte is decreased in Ctnnb1CA hep mice (B), however they occupy a larger area in the cell compared to WT animals (C). Peroxisoma (D) of Ctnnb1CA hep mice are highly enlarged and increased in number in Ctnnb1CA hep mice (B, E).

