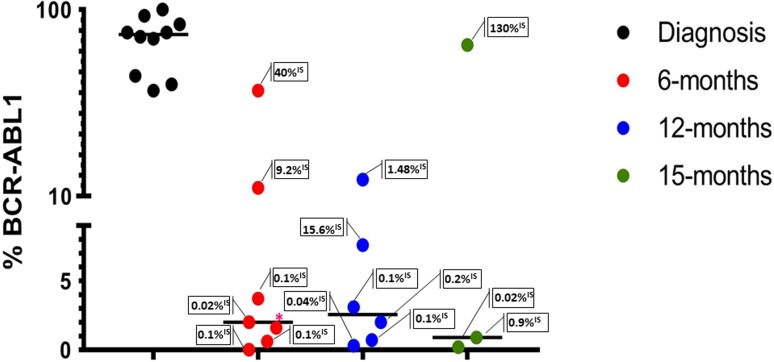
Figure 2. Absolute quantification of BCR-ABL1 genomic breakpoint by ddPCR EG assays at diagnosis and during the follow-up (6-12-15 months).
Each dot represents an evaluation; in the boxes the transcript amounts (RT-qPCR) are reported. The lines indicate the median for each group. BCR-ABL1% = [BCR–ABL1/(ZP3/2)] × 100. *%IS not available.

