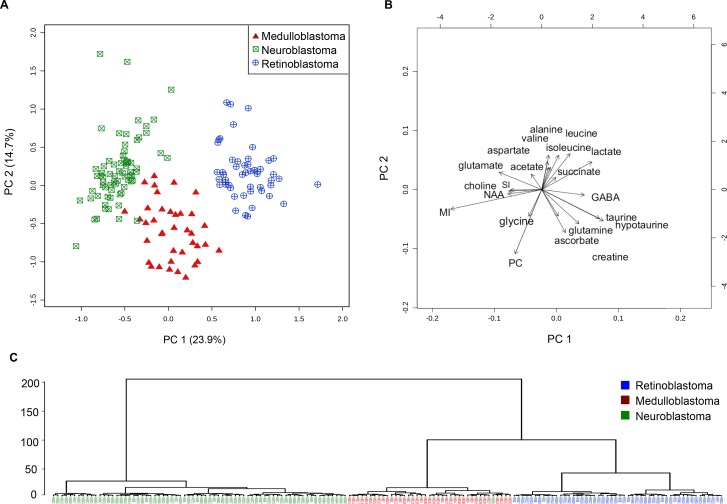
Figure 4. Embryonal tumor groups cluster separately in unsupervised multivariate analysis using metabolite concentrations.
(A) PCA scores plot demonstrating separate clusters for neuroblastoma (n = 70, squares), medulloblastoma (n = 39, triangles) and retinoblastoma (n = 50, circles) from left to right in principal component 1. (B) PCA scores biplot showing the metabolites elevated in each cluster. (C) Dendrogram analysis with Euclidian distance measure and Wards clustering method demonstrates that neuroblastoma tumors cluster to the left on their own branch. Medulloblastoma and retinoblastoma originate from the same right side branch, then divide and cluster separately. MI = myoinositol, SI = scylloinositol, PC = phosphocholine.

