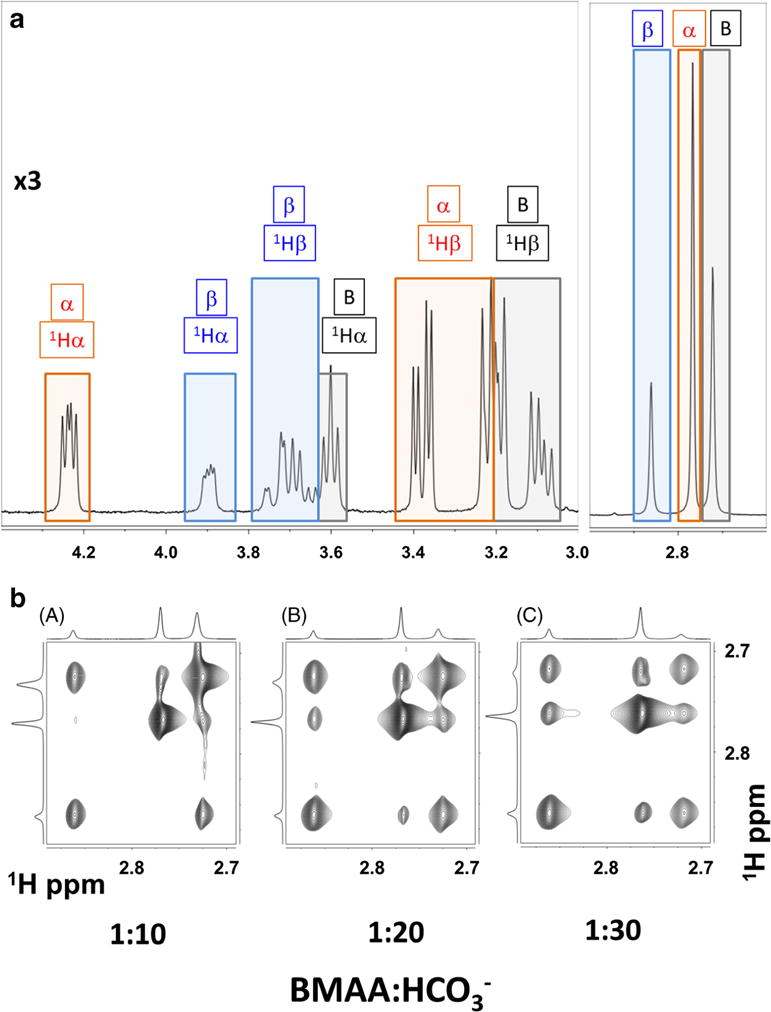
Fig. 5.

NMR spectral characterization of BMAA and its carbamate adducts. a 400 MHz 1H NMR spectrum of highlighting the coexistence of free BMAA (B: black boxes), α-carbamate adduct (α red boxes), and β-carbamate adduct (β: blue boxes). NMR spectra were recorded with 1:20 ratio of BMAA/HCO3− (10 mM/200 mM) in 100% D2O, pD of 7.6, and at 30 °C. b Effect of increasing bicarbonate concentration: Methyl region of the 400 MHz two-dimensional exchange spectroscopy (EXSY) spectra with increasing BMAA/HCO3− ratio: (A) 1:10, (B) 1:20, and (C) 1:30. The BMAA concentration was at 10 mM. EXSY spectrum is recorded at 30 °C and with a mixing time of 400 ms
