
Figure 2.
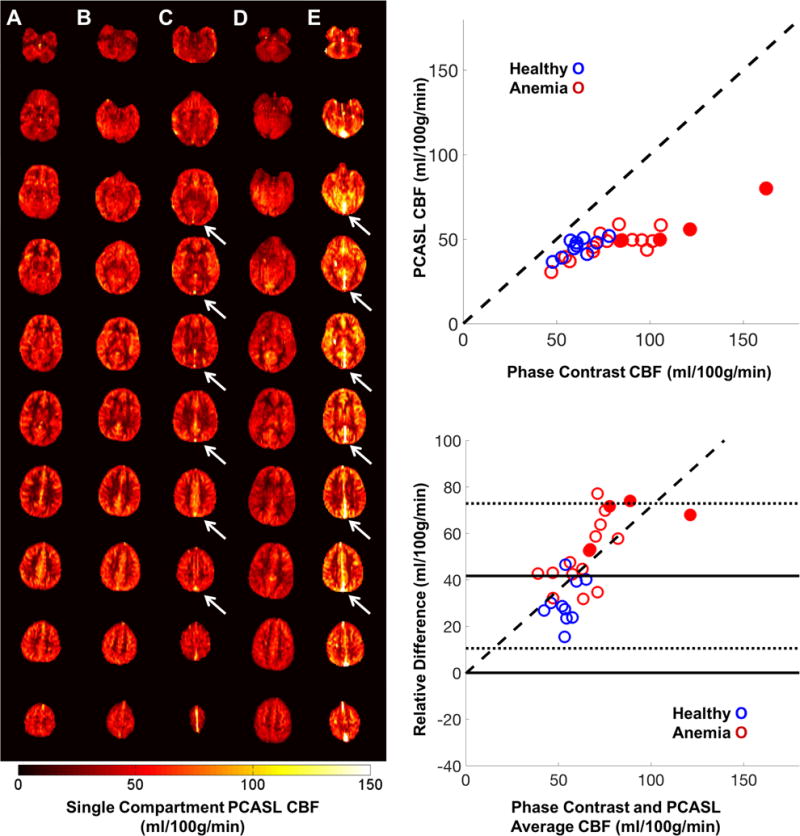
Left) Representative quantitative PCASL CBF maps in 5 subjects (1 CTL [A], 2 anemic, non SCD [B, C] and 2 SCD subjects, [D, E]) with increasing levels of anemia (left to right). Venous ASL signal is present in multiple slices of two anemic subjects (C, E white arrows). Right, Top) PCASL CBF with respect to PC CBF in healthy controls (blue) and anemic subjects (red). Right, Bottom) Bland Altman error plots demonstrate the measurement error grows with flow. Anemic subjects with venous outflow (closed circles) have higher flow and the larger relative error compared to those without venous outflow.