Abstract
An instrumentation capable of simultaneously determining degree of conversion (DC), polymerization stress (PS), and polymerization exotherm (PE) in real time was introduced to self-curing bone cements. This comprises the combination of an in situ high-speed near-infrared spectrometer, a cantilever-beam instrument with compliance-variable feature, and a microprobe thermocouple. Two polymethylmethacrylate-based commercial bone cements, containing essentially the same raw materials but differ in their viscosity for orthopedic applications, were used to demonstrate the applicability of the instrumentation. The results show that for both the cements studied the final DC was marginally different, the final PS was different at the low compliance, the peak of the PE was similar, and their polymerization rates were significantly different. Systematic variation of instrumental compliance for testing reveals differences in the characteristics of PS profiles of both the cements. This emphasizes the importance of instrumental compliance in obtaining an accurate understanding of PS evaluation. Finally, the key advantage for the simultaneous measurements is that these polymerization properties can be correlated directly, thus providing higher measurement confidence and enables a more in-depth understanding of the network formation process.
I. INTRODUCTION
Bone cement has been used extensively as the fixative material in a majority of orthopedic surgeries, such as hip and knee replacements1,2 and in other medical treatments such as bone fracture and percutaneous vertebroplasty.3,4 The number of these surgeries performed each year is expected to steadily increase as the size of the older population continues to increase worldwide.5,6 The most commonly used bone cement in these applications is based on the polymerization of methyl methacrylate (MMA) monomers to polymethylmethacrylate (PMMA) polymers through a self-curing process. Despite its widespread usage, the drawbacks of these bone cements are well known and an active effort to find alternative formulations exists.7–9 Three main drawbacks most often examined in the materials development and research of bone cements: the degree of conversion from monomers to polymers, which reflects the extent of polymerization, leaching of the residual monomer into the bloodstream has been reported to contribute to cardiorespiratory and vascular complications;10,11 the residual stress that develops in situ, as a result of polymerization, within a confined space can cause microcracks to develop within the cement and gaps at the interfaces,12,13 thus leading to the premature failure of the implant;14,15 and the heat evolved during the polymerization which may lead to necrosis of the surrounding bone tissue.16–18 Therefore, it is important in the materials development and research of bone cements to accurately follow the kinetics of these properties: the degree of monomer conversion (DC), the polymerization stress (PS), and the polymerization exotherm (PE), for a better assessment of the performance of the monomers as well as understanding and controlling of the curing process. The object of this study is to demonstrate an instrument capable of simultaneously collecting these parameters in real time for bone cements during the self-curing process.
The residual monomer, and hence the final DC, in bone cements has been measured in the literature using differential scanning calorimetry,19–21 electron-spin resonance,22,23 gas chromatography,24–26 FTIR,27,28 and proton nuclear magnetic resonance (1H NMR) spectroscopy.29,30 Of the techniques mentioned, only the differential scanning calorimeter has been used to track the DC, indirectly based on the exothermic heat released, in real time31,32 which is useful information for bone cement material researchers working on new formulations. To measure the development of PS and PE in PMMA bone cements, measurement devices have been developed that simulate the clinical use of bone cements for hip implants.33–38 These clinically relevant models were developed to understand the initial PS state of bone cement and to determine its impact on the lifetime of the bone cement. Finite element simulations have also been used to estimate the initial PS state of the bone cement along with comparisons with actual models.12,39–41 These studies of model hip implants demonstrate that the measured PS (0.5-25 MPa) and the peak PE (25-85 °C) can vary over a broad range. Additionally, large variations were found even within the same models between different runs.34,36,38 Most studies reason that the variation of PS and the peak PE values between similar models is a resultant of instrumental design, location of measurement, and volume of the sample.12,35–39 The literature mentioned here discusses methods and instruments which measure either one or two of the aforementioned properties and none of them measure the development of DC and PS simultaneously in real time which is a vital measurement to understand the critical inter-relationship between them and their kinetics in polymer composites. Also, in most of these instruments, each run requires a large amount of cement (about 40 g powder and 20 ml of liquid) which can be cost prohibitive and impractical when many samples need to be run, especially when working on new bone cement formulations.
In this study, an in situ highspeed near-infrared (NIR) spectrometer coupled with a cantilever beam-based instrument and a miniature thermocouple is introduced to follow the kinetics of these polymerization properties (DC, PS, and PE) simultaneously during the self-curing process of bone cements in real time. Two self-curing commercial bone cements having different viscosity were used to demonstrate the capability of the instrument for correlating the development of DC, PS, and PE, as well as the importance of instrumental compliances on the stress profile of the cements. Our results indicate that for both the bone cements the final DC was marginally different, the final PS was different at the low compliance only, the peak of the PE was similar and its polymerization rates were significantly different. Systematic variation of instrumental compliance revealed significant differences in the characteristics of PS profiles of both the cements. The study indicates the key advantage of the simultaneous measurements for the polymerization properties to unravel the complex interrelationship among the polymerization properties.
II. MATERIALS AND METHODS
A. Materials
Two commercial PMMA bone cements, Palacos R and Palacos LV, were obtained from Zimmer Surgical, Inc. (Dover, Ohio, USA). The two bone cements contain essentially the same raw materials; however, they differ in their handling characteristics. The Palacos R bone cement is a high viscous product which is considered ideal for conventional orthopedic procedures. The Palacos LV bone cement is a low viscosity version of the Palacos R bone cement, which is meant to be used for long, narrow nozzles used in some orthopedic procedures. The cements consist of two parts: a liquid (20 ml) and a powder component (40 g) (Table I).
TABLE I.
Composition of the PMMA bone cements.
| Powder compositiona | Palacos R (40 g) | Palacos LV (40 g) |
|---|---|---|
| Poly (methyl acrylate, methyl methacrylate) | 33.8 g (84.5%) | 33.6 g (84%) |
| Zirconium dioxide | 5.9 g (14.75%) | 6 g (15%) |
| Hydrous benzoyl peroxide | 0.3 g (0.75%) | 0.4 g (1%) |
| Liquid compositiona | Palacos R and Palacos LV (20 ml) | |
| Methyl methacrylate | 19.6 ml (97.9%) | |
| N,N-dimethyl-p-toluidine | 0.4 ml (2.1%) | |
Other constituents such as chlorophyll VIII in the powder, hydroquinone, and chlorophyll VIII in the liquid are mentioned by the manufacturer without exact quantity. Usually, these constituents are on the order of ppm.
B. Specimen preparation
In a typical clinical application of these commercial bone cements, the entire liquid and powder components are mixed for 30 s either at atmospheric pressure or under vacuum and then allowed to sit for 3 min to build viscosity and become workable. Only small amounts of the bone cement, 0.5 g of the powder and 0.25 ml of the liquid, are required for each run in the cantilever-beam instrument. The components were mixed manually (no vacuum) in a polyethylene bowl for 30 s, and the mixture was placed in a disposable plastic dental tip (Clear PCR from Centrix, Inc., Shelton, Connecticut, USA) and held for 2.5 min (to simulate working time42) prior to inserting it into the cantilever-beam instrument. All times were measured and reported from the start of the 30 s mixing process.
C. Instrumentation and methods
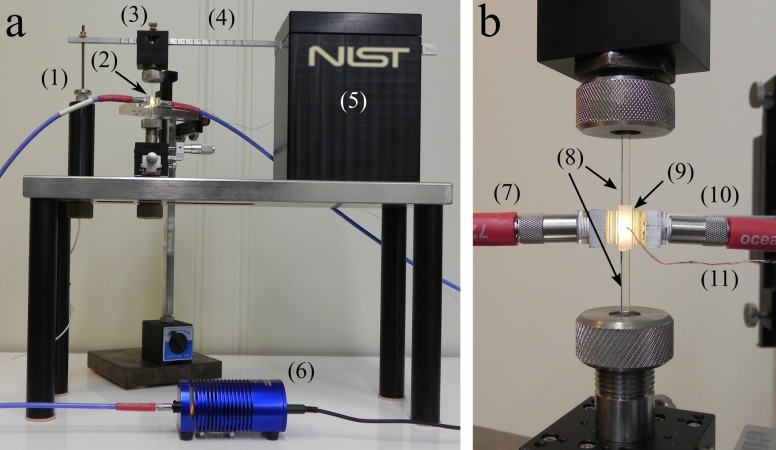
Based on the cantilever-beam concept presented in measurement devices,43–46 an instrument has been developed [Fig. 1(a)] at the National Institute of Standards and Technology (NIST) for simultaneous measurement of DC, PS, and the PE in real time.47,48 The design of the instrument follows first principles of mechanics; thus, it provides the combination of sensitivity and resolution for an unprecedented measurement performed on composites with high filler content subjected to various instrumental compliances. The instrument consists of a stainless-steel beam that is fixed at one end and allowed to move freely at the other. At the flexible end, a capacitive displacement sensor driver with a magnetic probe (CPL 190 from Lion Precision, Oakdale, Minnesota, USA) is attached that can measure the deflection of the beam at a RMS resolution of ca. 25 nm and at a bandwidth of 15 kHz. A collet is mechanically attached at a position along the cantilever beam which holds a 2.5 mm diameter quartz glass rod (the upper glass rod). A second quartz rod is held by a collet below the upper rod and fixed into position to the rigid base of the instrument. The two quartz rods were treated with a methacrylate silane to promote adhesion between the bone cement and rods. The rods are separated using a spacer of known dimensions (3 mm) and clamped into position. A non-tacky polytetrafluoroethylene (PTFE) sleeve with small inlet and outlet holes for sample injection is slid around the space between the two quartz rods to make a vacant cylinder with dimensions of 2.5 mm diameter and a height of 3 mm [Fig. 1(b)]. The premixed bone cement is injected to completely fill the cylinder approximately 2.5 min after mixing, and a microprobe thermocouple (0.13 mm diameter T-type from Omega Engineering, Inc., Stamford, Connecticut, USA) is inserted into the sample chamber through the inlet hole to measure the PE. Using a 1 mm diameter near-infrared (NIR) fiber optic cable (Ocean Optics, Inc., Winter Park, Florida, USA), the light from a halogen light source (HL−2000 from Ocean Optics, Inc., Winter Park, Florida, USA) is directed through the sleeve holding the cement sample [Fig. 1(b)] and then into a second 1 mm optical fiber cable attached to a NIR dispersive diode spectrometer (NIRQuest512 from Ocean Optics, Inc., Winter Park, Florida, USA). Every 2 s, a single transmission spectrum is obtained by averaging 50 individual spectra together at a rate of 50 Hz. The first overtone of the methylene C=C—H stretching mode (1622 nm) of the methyl methacrylate monomer is used to calculate the DC of the bone cement. By applying a baseline fit,48 taking the initial area of this band (Ai), and measuring the reduction in the area as the sample cures (At), the DC of the monomer is calculated using the following equation:
| (1) |
FIG. 1.
The overall view (a) and close-up view of the sample mounting region (b) of the cantilever-beam instrument: (1) capacitive displacement sensor; (2) cement sample; (3) upper collet holder; (4) steel cantilever beam; (5) cantilever beam mount; (6) NIR lamp; (7) fiber optic input from lamp; (8) upper and lower quartz rods; (9) PTFE sleeve encasing the cement sample; (10) fiber optic output to NIR detector; (11) T-type microprobe thermocouple.
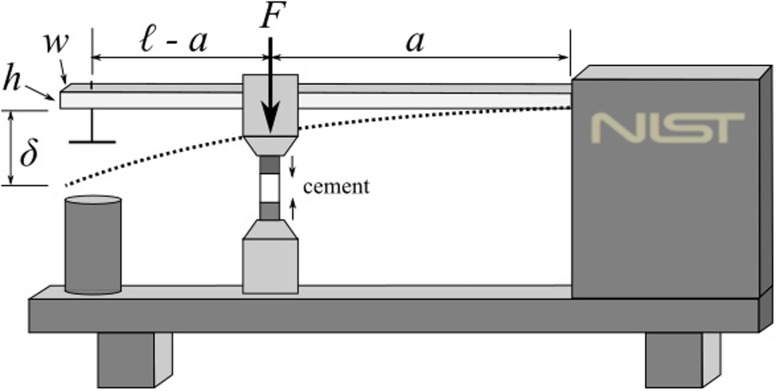
As the sample cures, it contracts due to the change in volume arising from polymerization and exotherm, and this contraction is resisted by the compliance of the cantilever beam (Fig. 2) and consequently causes the deflection of the beam. This deflection (δ) is accurately measured by the displacement sensor, and the PS resulting from the deflection can be deduced47 [Eq. (2)],
| (2) |
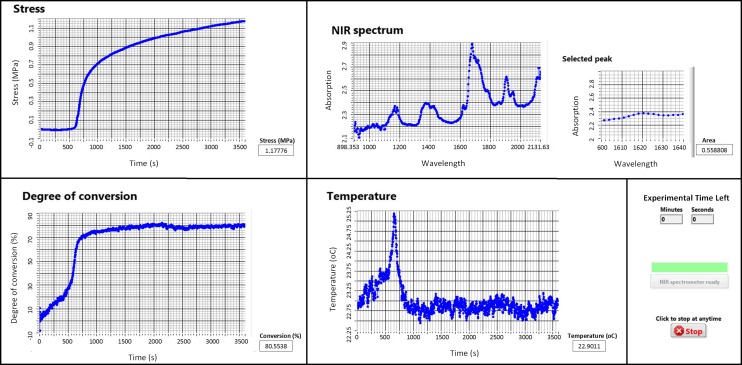
where F is the force resulting from the deflection of the beam, E is the Young’s modulus of the beam, A is the cross-sectional area of the cylindrical sample, and I is the moment of inertia (I = wh3/12 where w and h are the width and height) of the beam. The quantities ℓ and a are the distances between the fixed end of the beam and the displacement sensor and the sample location, respectively. Using a commercially available data acquisition platform (LabVIEW 2014 SP1, National Instruments Corporation, Austin, Texas, USA), the displacement of the beam is continuously measured and hence the development of the PS using Eq. (2). A screenshot of the graphic user interface (GUI) of the software built to acquire data from the instrument is shown in Fig. 3. In addition to showing the development of DC, PS, and PE in real time, the GUI displays a full-range NIR spectrum (wavelengths of ca. 900-2100 nm) and the smaller, selected peak region that is used to calculate the DC.
FIG. 2.
A schematic drawing of the cantilever-beam instrument.
FIG. 3.
A screenshot of the GUI of the software displaying the final results of a typical experiment during the polymerization of the bone cement. The software was built to collect, display, and store synchronously the DC, PS, and PE data during polymerization.
For each of the PMMA bone cement brands, a minimum of three runs at each compliance were conducted. Student’s t-test, ANOVA, and Mann-Whitney tests were performed (SigmaPlot version 13.0 from Systat Software, Inc., San Jose, California, USA) where appropriate for each of the measured parameters with a significance level of 95%, to identify differences between the measured parameters for both the bone cements and for each measured parameter at different compliances.
III. RESULTS AND DISCUSSION
A summary of all the parameters determined for the two bone cement brands, DC and PS measurements at the end of 1 h, the peak of the polymerization exotherm (PPE), and the setting time (tSET) at each compliance are given in Table II. Discussion about the individual measured properties is enumerated into Secs. III A–III D.
TABLE II.
Summary of the measurement data obtained for the bone cements using the instrument. The variance in the data represents one standard deviation.
| Palacos R | ||||
|---|---|---|---|---|
| Compliance | ||||
| (μm/N) | DCa (%) | PSa (MPa) | PPEb (°C) | tSETc (min) |
| 0.33 | 77.1 ± 1.3 | 1.513 ± 0.087 | 3.75 ± 0.21 | 11.56 ± 0.86 |
| 0.79 | 77.3 ± 2.6 | 1.155 ± 0.056 | 3.17 ± 0.13 | 10.39 ± 0.99 |
| 4.21 | 80.4 ± 3.7 | 0.446 ± 0.038 | 2.41 ± 0.53 | 12.62 ± 0.43 |
| 12.27 | 78.2 ± 2.3 | 0.250 ± 0.030 | 2.33 ± 0.47 | 13.42 ± 0.49 |
| 26.96 | 78.0 ± 3.1 | 0.176 ± 0.020 | 3.23 ± 0.76 | 11.47 ± 0.91 |
| 50.27 | 76.7 ± 3.4 | 0.111 ± 0.009 | 3.30 ± 0.27 | 12.05 ± 0.40 |
| 84.18 | 78.0 ± 0.7 | 0.081 ± 0.003 | 2.96 ± 0.47 | 10.31 ± 1.30 |
| Palacos LV | ||||
| Compliance | ||||
| (μm/N) | DCa (%) | PSa (MPa) | PPEb (°C) | tSETc (min) |
| 0.33 | 78.4 ± 3.5 | 1.314 ± 0.023 | 2.30 ± 0.4 | 15.50 ± 0.42 |
| 0.79 | 80.2 ± 0.8 | 1.145 ± 0.032 | 2.60 ± 0.2 | 13.50 ± 0.16 |
| 4.21 | 81.2 ± 3.6 | 0.440 ± 0.025 | 3.00 ± 1.03 | 14.44 ± 1.95 |
| 12.27 | 83.5 ± 2.8 | 0.231 ± 0.020 | 3.46 ± 0.39 | 13.96 ± 1.60 |
| 26.96 | 80.6 ± 3.0 | 0.146 ± 0.008 | 2.57 ± 0.75 | 12.85 ± 3.61 |
| 50.27 | 82.0 ± 2.7 | 0.125 ± 0.008 | 3.10 ± 0.78 | 14.74 ± 0.77 |
| 84.18 | 80.1 ± 1.4 | 0.078 ± 0.008 | 3.15 ± 0.37 | 15.13 ± 0.46 |
Values at the end of 1 h of the measurement.
PPE—Peak of the PE.
tSET—Setting time, time taken to reach half of the PPE.
A. Degree of conversion (DC)
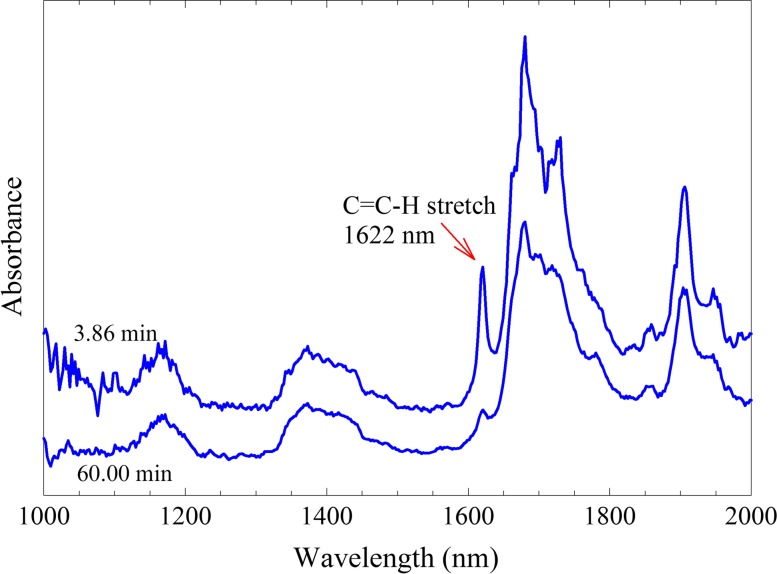
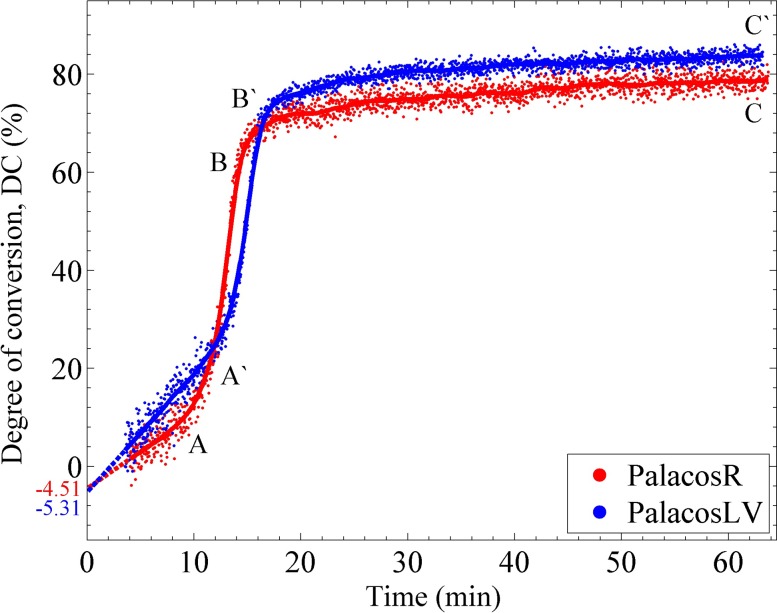
The incorporation of a NIR spectrometer into the instrument allows for the continuous measurement of DC of the MMA monomer. Examples of the averaged transmission spectra collected at different times in the polymerization are shown in Fig. 4. The upper spectrum was taken at t = 3.86 min after mixing the components of the Palacos R bone cement and acts as the initial spectrum taken in the experiment. Due to the heterogeneous nature of the bone cements (monomer/polymer/radio-opaque filler), the measurement of the area under the 1622 nm band was complicated. The scattering and attenuation of the NIR light passing through the sample caused slight fluctuations in the calculation of the peak area resulting in noise in the measurement of the DC. This is clearly evident in Fig. 5 showing the DC as a function of time for both the bone cements. In each experiment, the NIR light passed through 2.5 mm of bone cement which was the smallest practical sample diameter to work within the instrument. Samples of thicker diameter produced even greater noise in the DC data. While the noise in the NIR spectral data is not ideal, the trends in the DC profile are clearly apparent. In the first few minutes of the polymerization, the DC increased in a linear manner until ca. 10 min (point A on Fig. 5), at which time a sudden increase in rate was observed due to autoacceleration. This increased rate continued until approximately 15 min (point B) at which time the polymerization started to slow down due to the high viscosity of the cured cement and depletion of the MMA monomer. After 15 min, the DC increased but at a slower rate until a value of around 80% was calculated at t = 60 min (point C). The slower curing Palacos LV bone cement also displayed a similar DC profile as the Palacos R cement with a delayed set of transition points (points A′ and B′). The DC for both the bone cements is expected to increase slowly for up to a month,15 as can be seen from the slope of the DC curves at the end of 1 h. Palacos R achieved a final DC statistically lower (mean value lower by about 3.3%) than that of Palacos LV (α = 0.05, df = 66, p = 0.0008), and insignificant differences were found between the DC values measured at each compliance for both the bone cements.
FIG. 4.
Typical NIR spectra of the Palacos R bone cement taken at 3.86 min (top) after mixing and after 60 min (bottom) at an instrumental compliance of 4.2 μm/N.
FIG. 5.
The red and blue dots show a typical measurement of the DC of the Palacos R and Palacos LV bone cements at an instrumental compliance of 4.2 μm/N. The solid line through the dots is the running average used to smooth the plot.
The final DC is most likely a slight underestimation of the actual DC since the initial spectrum could not be obtained until ca. 3-4 min after mixing (Fig. 4). However, if we linearly extrapolate the DC curve (dashed line in Fig. 5), we can estimate that the DC was underestimated roughly by 4%-6% and, hence, the actual final DC would be around ca. 84%-86% (considering the average final DC was approximately 80% from Table II) at the end of 1 h. This corresponds to ca. 32-36.6 mg of the original 229 mg of methyl methacrylate monomer that remains unreacted. In the literature, researchers have reported residual monomer values of 2%-6%15,29 for commercial bone cements, that is, about 94%-98% DC. However, DC values similar to this study were reported in a few other studies.31,32 This differences in DC can be due to two reasons. First, some values in the literature were reported after times much longer than 1 h. As the DC values in the current study are seen to slowly increase even after 1 h, it is expected that longer measurement times would have resulted in an increase in the reported DC values as well. Second, larger masses of the bone cement were used in the literature which would result in a higher exotherm in the bone cement which would in turn increase the mobility and reactivity of the monomers and result in a higher DC at the end of 1 h.49 However, it is to be analyzed in a future study whether the volume of the bone cement to be cured has an effect on the DC after a long time, like a month, since the beginning of cure.
B. Polymerization stress (PS)
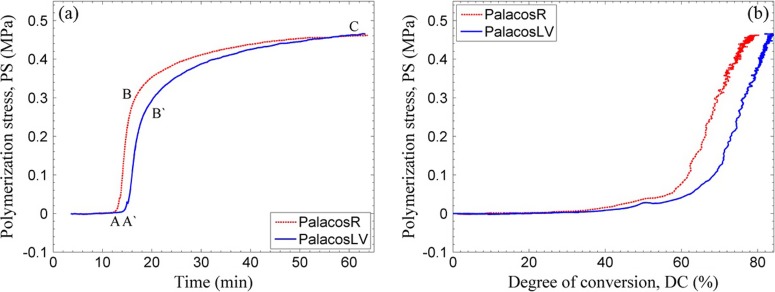
Figure 6(a) shows typical PS profiles for both the Palacos R and LV bone cements measured at a compliance of 4.2 μm/N. Upon initial mixing of the monomer with the initiator, a controlled polymerization occurs as discussed in Sec. III A, for both types of bone cements, and the PS remains essentially zero (before point A on the graph). At point A, after sufficient polymerization, the modulus of the cement reached a threshold beyond which any reduction in its volume due to polymerization leads to a deflection of the beam. It is to be noted that point A in Fig. 6(a) is delayed by ca. 2.5 min when compared with point A in Fig. 5 which corresponds to the autoacceleration effect. As polymerization continues, the volumetric shrinkage of the polymer produces a greater deflection of the beam until the point where the reaction slows and the PS begins to level off (point B). Even though the sample has vitrified and is essentially solid at this point, the stress continues to develop slowly until the final PS is observed after 1 h of reaction (point C). The PS continues to build at a slower rate for at least 6 h usually ending up about only ca. 10% higher at 6 h than at 1 h (not shown in the figure). The slower curing Palacos LV bone cement also displays a similar PS development profile as the Palacos R cement with the exception of a delayed onset of PS rise (point A′). The PS vs DC curve [Fig. 6(b)] gives the nonlinear relation between PS and polymerization shrinkage. A fair approximation would be to assume that the shrinkage due to polymerization alone is linearly related to DC. One can see that the PS build up is, however, nonlinear. This is because the initial shrinkage can be relaxed due to the flow in the material which has a low modulus, at this stage of curing, and any small shrinkage in the later stage can significantly increase the PS due to the larger elastic modulus at this DC.
FIG. 6.
Typical variation of PS with measurement time (a) and with DC (b) in the Palacos R and LV bone cements at an instrumental compliance of 4.2 μm/N.
A direct comparison of the PS values from this study to the ones in the literature is difficult to make due to several reasons. As mentioned earlier, most of the articles in the literature have focused on studying the three-dimensional residual stress that arises due to polymerization and thermal shrinkage in the bone cement. The distribution of the three-dimensional residual stress in the bone cement is a coupled effect of the local volume of the sample, the local temperature rise, the local compliance of the implant or the bone, and possible stress concentration points. In such a complex setting, it is difficult to decouple the influence due to the individual factors in order to compare the residual stress between different materials. Moreover, such a difficulty in comparison even between similar models has been mentioned in the literature.12,35–39 The cantilever-beam instrument introduced in this article is a simpler setup which enables one to compare, without such ambiguity, the one-dimensional axial PS developed in the materials.
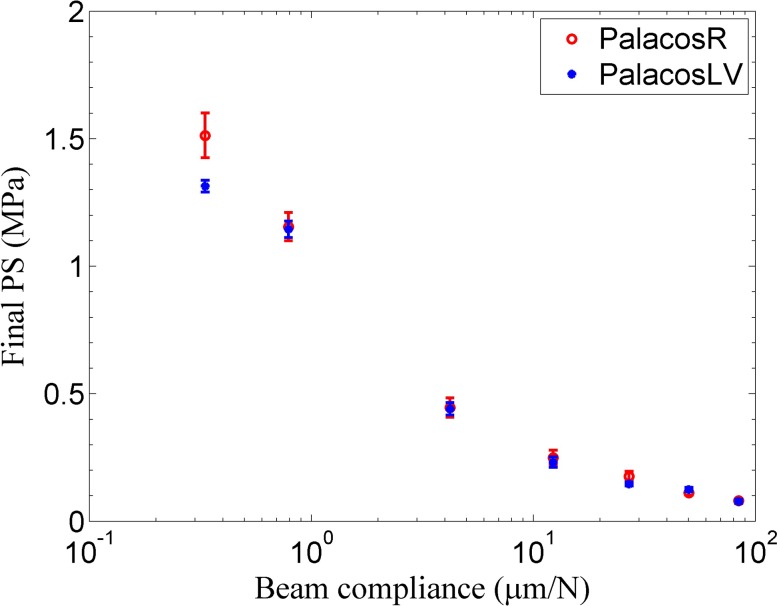
For a polymer composite, the development of polymerization stress depends upon the evolving elastic modulus, the volumetric shrinkage of the material (due to polymerization and thermal shrinkage), and additionally upon the mechanical constraints. Clinically, every material for which polymerization stress is to be determined is under some constraint. This constraint in the case of hip replacement surgeries is, for example, the titanium alloy implant. The compliance of the titanium alloy implant, as it is generally anchored at the hip joint, varies along its length, similar to a cantilever beam. To the best of the authors’ knowledge, the issue of the development of residual stress due to mechanically constrained geometries has been raised by a handful of researchers in the bone cement literature.27,50,51 The compliance of one such hip implant was estimated from the material properties and dimensions from a previous study by Nuño and Amabili.35 The titanium alloy, Ti-6Al-4V, from which the hip implant is made up of, has a Young’s modulus of 110 GPa, a length of 120 mm, and a radius of 5 mm. By taking a crude approximation that the implant acts like a cantilever which is fixed at the hip bone, one can calculate that the compliance of the implant (the inverse of the bending stiffness in this case) is in the range of 0.395 μm/N (estimated at around 40 mm from the fixed end, as some part of the stem is outside the bone cement) to 10.667 μm/N (at the bottom end of the implant). Figure 7 shows the final PS measured for both the Palacos R and LV bone cements at compliances ranging from 0.33 μm/N to 84 μm/N. The PS dropped markedly with the increase in instrument compliance for both the bone cements. The various instrumental compliances were achieved by changing the specimen position along different cantilever beams. As reported in our previous study,52 by combining different beam materials and dimensions, an instrumental compliance ranging from 0.33 μm/N to 2186.06 μm/N can be obtained with the cantilever-beam instrument. The compliance of the instrument was varied beyond the higher end of the estimated compliance (10.667 μm/N) of the implant to show that one of the reasons for the large variation of the PS (0.5-25 MPa) reported in the literature33–35 could be a result of measuring the value at different compliances.
FIG. 7.
The variation of the final PS with beam compliance for the two PMMA bone cements. The vertical bars represent one standard deviation.
The shrinkage of the material is resisted by the stiffness of the beam at the location where the experiment is being run. As the stiffness of the cantilever beam changes along its length, the resistance provided by it to the shrinkage in the material changes. The force that the material can transfer to the beam depends not only on the shrinkage but also on its evolving elastic modulus. From the literature on uniaxial stress measurement of dental composites, it is well known that the relative contribution of the elastic modulus and the volumetric shrinkage in the material to the PS varies with respect to the compliance of the beam.52–55 For example, if one considers the volumetric shrinkage of two materials to be roughly the same, then the PS value of each material follows the trend of their respective elastic modulus at low compliances. Additionally, the PS value of each material does not depend significantly on the modulus of the composite at high compliances and will follow the trend of their volumetric shrinkages. Hence, assuming the same volumetric shrinkage of the two materials (due to the same monomer content), the difference in the modulus between the two bone cement materials (Palacos R has a higher elastic modulus than Palacos LV42,56) might have caused the statistically significant differences in the PS of the two materials at the lowest compliance (α = 0.05, df = 4, p = 0.027). The initial residual stress of the bone cement is an important indicator of the in vivo life of the implant as it can help determine if cracks develop in the bone cement, if interface gaps are formed between the cement-implant and cement-bone interfaces, and how the stress is distributed in the cement as load is applied.34,57 Additionally, it has been discussed that the porosity of the bone cement is influenced by the compliance of its environment,27,51 which is known to significantly affect the life of the implant. Further research can be directed with this proposed instrument towards studying the systematic effect of compliance on porosity. Finally, some studies have discussed that the residual stresses may be relaxed due to the viscoelastic property of the bone cement58,59 and that they are highly dependent on the age of the samples. However, no creep was observed at any compliance in the current study, in the 1 h runs that were done for each test.
C. Polymerization exotherm (PE)
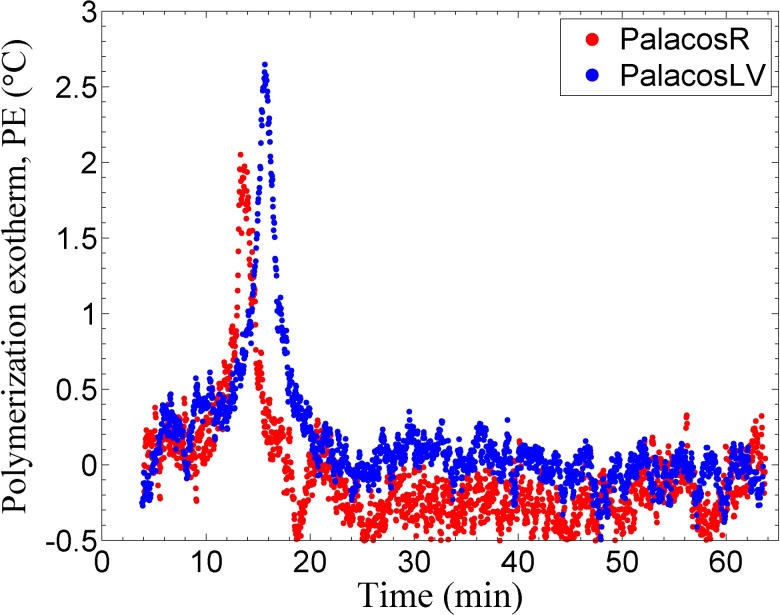
As the polymerization of the MMA monomer is an exothermic reaction, the temperature was tracked with a microprobe thermocouple which was inserted into the curing bone cement within the sample chamber of the instrument. All samples were initially mixed at room temperature (20 °C–21 °C), so typically a 2 °C–4 °C maximum change in the temperature was observed during the polymerization (Fig. 8 and Table II). The values reported in the literature range from 25 °C to 85 °C;29,33,60 this large variation can be attributed to three main factors: the volume of bone cement sample used, the experimental design, and the location of measurement. The small PPE reported here, as compared to the ones in the literature, is mainly due to the small volume of the cement used per sample run in the current work (a cylinder of 2.5 mm diameter and a height of 3 mm).
FIG. 8.
PE of the bone cements, measurement shown is relative to the ambient temperature at an instrumental compliance of 4.2 μm/N. (The accuracy of the thermocouple is ±0.5 °C which accounts for the noise seen in the data.)
The variation in the measured PE was more significant than that in the PS or DC measurements mostly due to the difficulty in repeatedly placing the microprobe thermocouple in the same position in the sample. Slight deviations in the position of the thermocouple within the sample (center of the sample as compared to more toward the edge) cause the measured PE to vary. Regardless, the setting time (tSET, Table II) was still able to be measured with precision. The setting time for the Palacos R and Palacos LV bone cement has been reported to be around 7.5–8.5 min and 10–12 min at room temperature (19 °C–21 °C), respectively.42 These values are significantly lower than the results obtained in this study and can be attributed to the volume of the bone cement used. As it has been mentioned earlier, a larger mass of the cement (conventionally 40 g of the powder and 20 ml of the liquid is used) would result in a higher PPE and this would result in a faster reaction of the monomer which would decrease the setting time. The difference in PPE between the two commercial samples was statistically insignificant (α = 0.05, U = 538.50, p = 0.702), and tSET for Palacos R was statistically shorter (mean value lower by 18.4%) than that for Palacos LV (α = 0.05, df = 66, p = 4.71 × 10⁻¹²). The difference in PPE and tSET was statistically insignificant at each compliance for Palacos LV but was significant for Palacos R. The intrinsic property of the material such as DC, PE, and tSET should be independent of the compliance. As statistically insignificant differences were found in DC between each compliance for both the bone cements, the difference in PPE and tSET between different compliances for Palacos R is likely due to, as stated earlier, the difficulty in repeatedly placing the microprobe thermocouple in the same position in the sample.
D. Comparison of polymerization characteristics
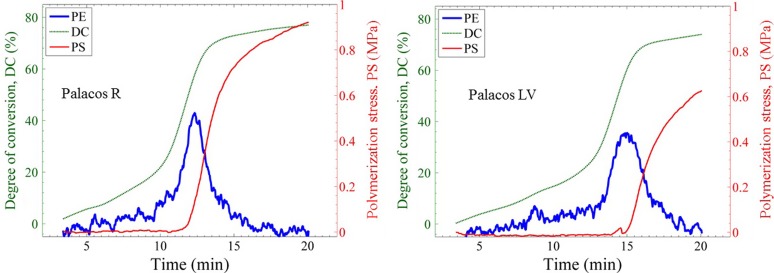
The kinetics and the development of DC, PS, and PE contribute to the mechanical properties of the bone cements. Since the instrument is capable of simultaneous measurement of these properties, it is a useful instrument for the development of improved bone cement materials. Figure 9 shows the overlay of the three measured values of the two bone cements in which the PE profile has been arbitrarily scaled on the y-axis to aid in the comparison of the trends. As the polymerization occurs, both the DC and PE increase slowly until the DC begins to increase at a different rate due to the onset of auto-acceleration. This process is followed by a subsequent peak in the PE (PPE, Table II) and a simultaneous upturn in the PS. For all the Palacos LV bone cement tests, a transient stress peak of the PS was seen (at ca. 14.5 min). This transient stress peak region was observed to match closely with the PPE. This suggested that the thermal expansion of the bone cement at this time outpaced the polymerization contraction for a brief few seconds. Such a transient peak was also observed by Nuño et al.,36 although the geometry and the nature of the stress causing such a peak was different. Nevertheless, the onset of rapid change in strain and stress was seen to occur right around the timing of the PPE34,36,37 which supports the general notion that the thermal shrinkage of the polymer is significantly related to the stress increase. However, one can see that the DC is also rapidly increasing in this time frame. From looking at the values of DC and PS reached at the time of PPE and at the time when the temperature reaches back to ambient temperature, one can better comment on the contribution of thermal shrinkage and polymerization shrinkage on the development of the PS. For example, from Fig. 9, the DC reached 77.6% and 83.4% of its final value for the Palacos R and Palacos LV, respectively, at the timing of their respective PPE. The PS value reached only 11.1% and 0.7% of its final value for the Palacos R and Palacos LV, respectively, at the timing of their respective PPE. Now, by the time the temperature reached back to the ambient temperature (at ca. 16.1 min and 20.2 min for Palacos R and Palacos LV, respectively, Fig. 9), the DC reached 92.4% and 96.4% of its final value for the Palacos R and Palacos LV, respectively. However, the PS reached only 68.6% and 59.5% of its final value for the Palacos R and Palacos LV, respectively. Hence, it suggests that the small incremental DC of about 7.6% and 3.6% resulted in a 31.4% and 41.5% increase in the PS of Palacos R and Palacos LV, respectively. This late increase in DC relates to a significant increase in the elastic modulus which results in a steep rise in the PS [Fig. 6(b)]. It is to be noted that as the PS changes significantly with the compliance, these percentage values mentioned would significantly vary with compliance. More specifically, the contribution due to the PS rise from the late increase in the elastic modulus will decrease with increasing compliance. For example, the PS rise after the temperature reached ambient temperature till the end of measurement is only about 12.5% and 11.4% for the Palacos R and Palacos LV, respectively, at a compliance of 84.18 μm/N. However, the DC percentage values did not vary significantly with respect to the PE because of these measurements being unaffected by the compliance of the measurement. Hence, it can be argued that due to the almost simultaneous rise in DC and PE, one could say that the contribution of PS rise due to the combination of polymerization shrinkage, thermal shrinkage, and increasing modulus is compliance dependent.
FIG. 9.
Comparison of the degree of conversion (DC), polymerization stress (PS), and polymerization exotherm (PE) of Palacos R and Palacos LV bone cements at an instrument compliance of 0.79 μm/N. The PE has been arbitrarily scaled on the y-axis to aid in the comparison of the trends.
In current clinical practice, bone cements used for cemented total hip and knee joint replacements are vacuum mixed and delivered to the bone bed. However, in the current study, the bone cements were hand mixed under ambient conditions. It is documented in the literature that vacuum mixed cements undergo larger volumetric shrinkage and achieve higher PPE than when hand-mixed.27,60,61 This could be attributed to the porosity introduced into the sample during hand-mixing leaving pores that can reduce the overall temperature (air being a bad conductor of heat) of the composite, which can in return reduce the thermal shrinkage. The higher PPE may result in an increase in the mobility of the monomer resulting in a larger DC. An increase in DC would result in an increase in modulus, as observed in the literature.61,62 As the measured PS is significantly related to its volumetric shrinkage and its elastic modulus, one would expect that the PS will increase for each commercial cement tested at each compliance when vacuum mixing is used. An increase in PPE would also result in a decrease in the tSET, as the rate of the reaction increases with temperature. However, because of the small sample sizes used on the instrument, one could argue that an insignificant increase in PPE would be seen, hence, might not result in a significant decrease in tSET or a significant increase in DC which in turn might not lead to drastic differences in PS with vacuum mixing.
In addition to hand mixing of the bone cements, another limitation of the study is that the experiments were done at the ambient temperature (20 °C–21 °C) and not under the clinically relevant body temperature (∼37 °C). It is known that the polymerization rate increases with an increase in temperature; an increased rate would result in an increase in PPE, which would in turn increase the thermal shrinkage resulting in a higher PS. A slight increase in DC, measured at the end of 1 h, can also be expected as an increase in PPE would allow more mobility of the monomer and hence a larger DC which again could increase the PS. Finally, an increase in the environment temperature should result in a decrease in the tSET.63 Hence, vacuum mixing and running the experiments at body temperature would both cumulatively increase the final DC, final PS, PPE and would decrease tSET.
IV. CONCLUSIONS
A cantilever-beam based instrument incorporated with an in situ, high-speed NIR spectrometer and a microprobe thermocouple has been introduced that is capable of simultaneously measuring the degree of monomer conversion, the development of polymerization stress, and the polymerization exotherm in real time for self-cured bone cements. Additionally, the design of instrument allows the stress that develops in the sample to be measured at different compliances similar to what the local bone cement experiences based on its location on the implant. Two commercial PMMA bone cements were studied to demonstrate the capability of the introduced instrument. The degree of conversion was marginally different, the final polymerization stress was different at the low compliance only, the peaks of the polymerization exotherm were similar, and the setting time was significantly different for both the bone cements. For both the bone cements, the polymerization stress dropped markedly with an increase in beam compliance. Hence, the compliance is a critical parameter to report while determining the polymerization stress of bone cements. It is expected that this instrument could be used to rapidly evaluate existing commercial bone cements or provide new insights into kinetics and property relationships for new bone cement formulations being developed.
ACKNOWLEDGMENTS
This study is based on research that was funded partially by Interagency Agreement between the National Institute of Dental and Craniofacial Research and the National Institute of Standards and Technology, NIH/NIDCR [No. ADE12017-0000].
Certain commercial materials and equipment are identified in this manuscript in order to specify adequately the experimental and analysis procedures. In no case does such identification imply recommendation or endorsement by the National Institute of Standards and Technology (NIST) nor does it imply that they are necessarily the best available for the purpose.
REFERENCES
- 1.Malchau H., Herberts P., Eisler T., Garellick G., and Söderman P., J. Bone Jt. Surg., Am. 84, 2 (2002). 10.2106/00004623-200200002-00002 [DOI] [PubMed] [Google Scholar]
- 2.National Joint Registry, 12th Annual Report, 2014.
- 3.McGraw J. K., Lippert J. A., Minkus K. D., Rami P. M., Davis T. M., and Budzik R. F., J. Vasc. Interventional Radiol. 13, 883 (2002). 10.1016/s1051-0443(07)61770-9 [DOI] [PubMed] [Google Scholar]
- 4.Moreira-Gonzalez A., Jackson I. T., Miyawaki T., Barakat K., and DiNick V., J. Craniofacial Surg. 14, 144 (2003). 10.1097/00001665-200303000-00003 [DOI] [PubMed] [Google Scholar]
- 5.Kurtz S., Ong K., Lau E., Mowat F., and Halpern M., J. Bone Jt. Surg., Am. 89, 780 (2007). 10.2106/00004623-200704000-00012 [DOI] [PubMed] [Google Scholar]
- 6.Wilson N. A., Schneller E. S., Montgomery K., and Bozic K. J., Health Aff. 27, 1587 (2008). 10.1377/hlthaff.27.6.1587 [DOI] [PubMed] [Google Scholar]
- 7.Cervantes-Uc J. M., Cauich-Rodríguez J. V., Hernández-Sánchez F., and Chan-Chan L. H., “Bone Cements: Formulation, Modification, and Characterization,” in Encyclopedia of Biomedical Polymers and Polymeric Biomaterials (Taylor and Francis, 2015), pp. 1053–1066. 10.1081/e-ebpp-120050598 [DOI] [Google Scholar]
- 8.Lewis G., J. Biomed. Mater. Res., Part B 84B, 301 (2008). 10.1002/jbm.b.30873 [DOI] [PubMed] [Google Scholar]
- 9.Hernandez L., Muñoz M. E., Goni I., and Gurruchaga M., J. Biomed. Mater. Res., Part B 87B, 312 (2008). 10.1002/jbm.b.31105 [DOI] [PubMed] [Google Scholar]
- 10.Linder L., J. Bone Jt. Surg. 59, 82 (1977). 10.2106/00004623-197759010-00015 [DOI] [PubMed] [Google Scholar]
- 11.Sturup J., Madsen J., Tondevold E., and Jensen J. S., Acta Orthop. Scand. 61, 143 (1990). 10.3109/17453679009006507 [DOI] [PubMed] [Google Scholar]
- 12.Lennon A. B. and Prendergast P. J., J. Biomech. 35, 311 (2002). 10.1016/s0021-9290(01)00216-0 [DOI] [PubMed] [Google Scholar]
- 13.Miller J., Burke D., Stachiewicz J., Ahmed A., and Keiebay L., in The Hip, Proceedings of the 6th Open Scientific Meeting of the Hip Society (Mosby, 1978), p. 64. [Google Scholar]
- 14.Lewis G., J. Biomed. Mater. Res. 38, 155 (1997). [DOI] [PubMed] [Google Scholar]
- 15.Kühn K.-D., Bone Cements: Up-to-Date Comparison of Physical and Chemical Properties of Commercial Materials (Springer Berlin Heidelberg, New York, 2000). [Google Scholar]
- 16.Dipisa J. A., Sih G. S., and Berman A. T., Clin. Orthop. Relat. Res. 121, 95 (1976). 10.1097/00003086-197611000-00013 [DOI] [PubMed] [Google Scholar]
- 17.Lai P.-L., Tai C.-L., Chen L.-H., and Nien N.-Y., BMC Musculoskeletal Disord. 12, 116 (2011). 10.1186/1471-2474-12-116 [DOI] [PMC free article] [PubMed] [Google Scholar]
- 18.Toksvig-Larsen S., Franzen H., and Ryd L., Acta Orthop. Scand. 62, 102 (1991). 10.3109/17453679108999232 [DOI] [PubMed] [Google Scholar]
- 19.Migliaresi C., Fambri L., and Kolarik J., Biomaterials 15, 875 (1994). 10.1016/0142-9612(94)90110-4 [DOI] [PubMed] [Google Scholar]
- 20.Yang J., Biomaterials 18, 1293 (1997). 10.1016/s0142-9612(97)00060-4 [DOI] [PubMed] [Google Scholar]
- 21.Lewis G. and Mishra S. R., J. Biomed. Mater. Res., Part B 81B, 524 (2007). 10.1002/jbm.b.30693 [DOI] [PubMed] [Google Scholar]
- 22.Turner R. C., J. Biomed. Mater. Res. 18, 467 (1984). 10.1002/jbm.820180502 [DOI] [PubMed] [Google Scholar]
- 23.Park J. B., Turner R. C., and Atkins P. E., Biomater., Med. Devices, Artif. Organs 8, 23 (1980). 10.3109/10731198009118970 [DOI] [PubMed] [Google Scholar]
- 24.Demian H. W. and McDermott K., Biomaterials 19, 1607 (1998). 10.1016/s0142-9612(97)00122-1 [DOI] [PubMed] [Google Scholar]
- 25.Vallo C. I., Montemartini P. E., and Cuadrado T. R., J. Appl. Polym. Sci. 69, 1367 (1998). [DOI] [Google Scholar]
- 26.J. G. F. Santos, Jr., Pita V. J. R. R., Melo P. A., Nele M., and Pinto J. C., Braz. J. Chem. Eng. 28, 229 (2011). 10.1590/s0104-66322011000200007 [DOI] [Google Scholar]
- 27.Gilbert J. L., Hasenwinkel J. M., Wixson R. L., and Lautenschlager E. P., J. Biomed. Mater. Res. 52, 210 (2000). [DOI] [PubMed] [Google Scholar]
- 28.Hasenwinkel J. M., Lautenschlager E. P., Wixson R. L., and Gilbert J. L., J. Biomed. Mater. Res. 59, 411 (2002). 10.1002/jbm.1257 [DOI] [PubMed] [Google Scholar]
- 29.Vazquez B., Deb S., and Bonfield W., J. Mater. Sci.: Mater. Med. 8, 455 (1997). 10.1023/a:1018565807727 [DOI] [PubMed] [Google Scholar]
- 30.Cervantes-Uc J. M., Vázquez-Torres H., Cauich-Rodríguez J. V., Vázquez-Lasa B., and San Román del Barrio J., Biomaterials 26, 4063 (2005). 10.1016/j.biomaterials.2004.10.030 [DOI] [PubMed] [Google Scholar]
- 31.Maffezzoli A., J. Therm. Anal. 47, 35 (1996). 10.1007/bf01982684 [DOI] [Google Scholar]
- 32.Maffezzoli A., Ronca D., Guida G., Pochini I., and Nicolais L., J. Mater. Sci.: Mater. Med. 8, 75 (1997). 10.1023/a:1018502731892 [DOI] [PubMed] [Google Scholar]
- 33.Ahmed A. M., Pak W., Burke D. L., and Miller J., J. Biomech. Eng. 104, 21 (1982). 10.1115/1.3138300 [DOI] [PubMed] [Google Scholar]
- 34.Roques A., Browne M., Taylor A., New A., and Baker D., Biomaterials 25, 4415 (2004). 10.1016/j.biomaterials.2003.11.009 [DOI] [PubMed] [Google Scholar]
- 35.Nuño N. and Amabili M., Clin. Biomech. 17, 41 (2002). 10.1016/s0268-0033(01)00104-8 [DOI] [PubMed] [Google Scholar]
- 36.Nuño N., Madrala A., and Plamondon D., J. Biomech. 41, 2605 (2008). 10.1016/j.jbiomech.2008.06.030 [DOI] [PubMed] [Google Scholar]
- 37.Hingston J. A., Dunne N. J., Looney L., and McGuinness G. B., Proc. Inst. Mech. Eng., Part H 222, 933 (2008). 10.1243/09544119jeim343 [DOI] [PubMed] [Google Scholar]
- 38.Griza S., Ueki M. M., Souza D. H. G., Cervieri A., and Strohaecker T. R., J. Mech. Behav. Biomed. Mater. 18, 29 (2013). 10.1016/j.jmbbm.2012.09.018 [DOI] [PubMed] [Google Scholar]
- 39.Briscoe A. and New A., J. Biomech. 43, 978 (2010). 10.1016/j.jbiomech.2009.10.043 [DOI] [PubMed] [Google Scholar]
- 40.Pérez M. A., Nuño N., Madrala A., García-Aznar J. M., and Doblaré M., Comput. Biol. Med. 39, 751 (2009). 10.1016/j.compbiomed.2009.06.002 [DOI] [PubMed] [Google Scholar]
- 41.Nuño N. and Avanzolini G., J. Biomech. 35, 849 (2002). 10.1016/s0021-9290(02)00026-x [DOI] [PubMed] [Google Scholar]
- 42.Kuehn K., Ege W., and Gopp U., Orthop. Clin. North Am. 36, 17 (2005). 10.1016/j.ocl.2004.06.010 [DOI] [PubMed] [Google Scholar]
- 43.Watts D., Marouf A., and Al-Hindi A., Dent. Mater. 19, 1 (2003). 10.1016/s0109-5641(02)00123-9 [DOI] [PubMed] [Google Scholar]
- 44.Lu H., Stansbury J. W., Dickens S. H., Eichmiller F. C., and Bowman C. N., J. Mater. Sci.: Mater. Med. 15, 1097 (2004). 10.1023/b:jmsm.0000046391.07274.e6 [DOI] [PubMed] [Google Scholar]
- 45.Lu H., Stansbury J. W., Dickens S. H., Eichmiller F. C., and Bowman C. N., J. Biomed. Mater. Res. 71B, 206 (2004). 10.1002/jbm.b.30088 [DOI] [PubMed] [Google Scholar]
- 46.Lu H., Stansbury J., and Bowman C., J. Dent. Res. 84, 822 (2005). 10.1177/154405910508400908 [DOI] [PubMed] [Google Scholar]
- 47.Chiang M. Y. M., Giuseppetti A. A. M., Qian J., Dunkers J. P., Antonucci J. M., Schumacher G. E., and Gibson S., Dent. Mater. 27, 899 (2011). 10.1016/j.dental.2011.05.006 [DOI] [PMC free article] [PubMed] [Google Scholar]
- 48.Wang Z., Landis F. A., Giuseppetti A. A. M., Lin-Gibson S., and Chiang M. Y. M., Dent. Mater. 30, 1316 (2014). 10.1016/j.dental.2014.09.006 [DOI] [PMC free article] [PubMed] [Google Scholar]
- 49.Vallo C. I., J. Biomed. Mater. Res. 63, 627 (2002). 10.1002/jbm.10334 [DOI] [PubMed] [Google Scholar]
- 50.Gilbert J. L., J. Biomed. Mater. Res., Part A 79A, 999 (2006). 10.1002/jbm.a.v79a:1 [DOI] [PubMed] [Google Scholar]
- 51.Pelletier M. H., Lau A. C. B., Smitham P. J., Nielsen G., and Walsh W. R., Acta Biomater. 6, 886 (2010). 10.1016/j.actbio.2009.09.016 [DOI] [PubMed] [Google Scholar]
- 52.Wang Z. and Chiang M. Y. M., Dent. Mater. 32, 343 (2016). 10.1016/j.dental.2015.11.003 [DOI] [PubMed] [Google Scholar]
- 53.Min S., Ferracane J., and Lee I., Dent. Mater. 26, 1024 (2010). 10.1016/j.dental.2010.07.002 [DOI] [PubMed] [Google Scholar]
- 54.Lee S. H., Chang J., Ferracane J., and Lee I. B., Dent. Mater. 23, 1093 (2007). 10.1016/j.dental.2006.10.003 [DOI] [PubMed] [Google Scholar]
- 55.Wang Z. and Chiang M. Y. M., Dent. Mater. 32, 551 (2016). 10.1016/j.dental.2016.01.006 [DOI] [PMC free article] [PubMed] [Google Scholar]
- 56.Kuehn K., Ege W., and Gopp U., Orthop. Clin. North Am. 36, 29 (2005). 10.1016/j.ocl.2004.06.011 [DOI] [PubMed] [Google Scholar]
- 57.Taylor M. and Prendergast P. J., J. Biomech. 48, 767 (2015). 10.1016/j.jbiomech.2014.12.019 [DOI] [PubMed] [Google Scholar]
- 58.Eden O. R., Lee A. J. C., and Hooper R. M., Proc. Inst. Mech. Eng., Part H 216, 195 (2002). 10.1243/0954411021536405 [DOI] [PubMed] [Google Scholar]
- 59.Lee A. J. C., Ling R. S. M., Gheduzzi S., Simon J., and Renfro R. J., J. Mater. Sci.: Mater. Med. 13, 723 (2002). 10.1023/a:1016150403665 [DOI] [PubMed] [Google Scholar]
- 60.Dunne N. J. and Orr J. F., J. Mater. Sci.: Mater. Med. 13, 17 (2002). 10.1023/a:1013670132001 [DOI] [PubMed] [Google Scholar]
- 61.Orr J. F., Dunne N. J., and Quinn J. C., Biomaterials 24, 2933 (2003). 10.1016/s0142-9612(03)00055-3 [DOI] [PubMed] [Google Scholar]
- 62.Dunne N. J. and Orr J. F., Biomaterials 22, 1819 (2001). 10.1016/s0142-9612(00)00363-x [DOI] [PubMed] [Google Scholar]
- 63.Haas S. S., Brauer G. M., and Dickson G., J. Bone Jt. Surg. 57, 380 (1975). 10.2106/00004623-197557030-00017 [DOI] [PubMed] [Google Scholar]


