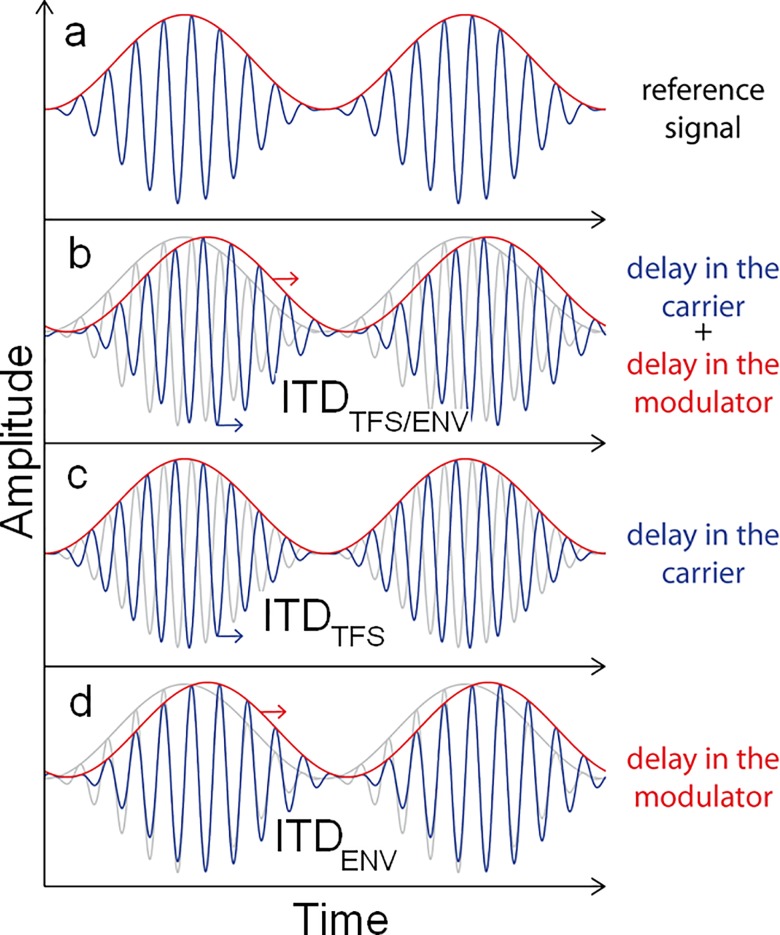
FIG. 1.
(Color online) Schematic diagram of the stimuli used in experiment 1. The waveform (rapid oscillation, blue online) and envelope (slower oscillation, red online) of the diotic reference stimulus are shown in (a). (b)–(d) show the waveforms and envelopes of the target stimuli in the lagging ear, with ITDs in both the carrier and the modulator [ITDTFS/ENV, (b)], the carrier only [ITDTFS, (c)], and the modulator only [ITDENV, (d)]. In panels (b) and (c), the faint lines show the waveform and envelope in the leading ear. In (b), to make the ITDs clearly visible, ITDENV was greater than ITDTFS. In the actual experiment ITDENV was equal to ITDTFS.

