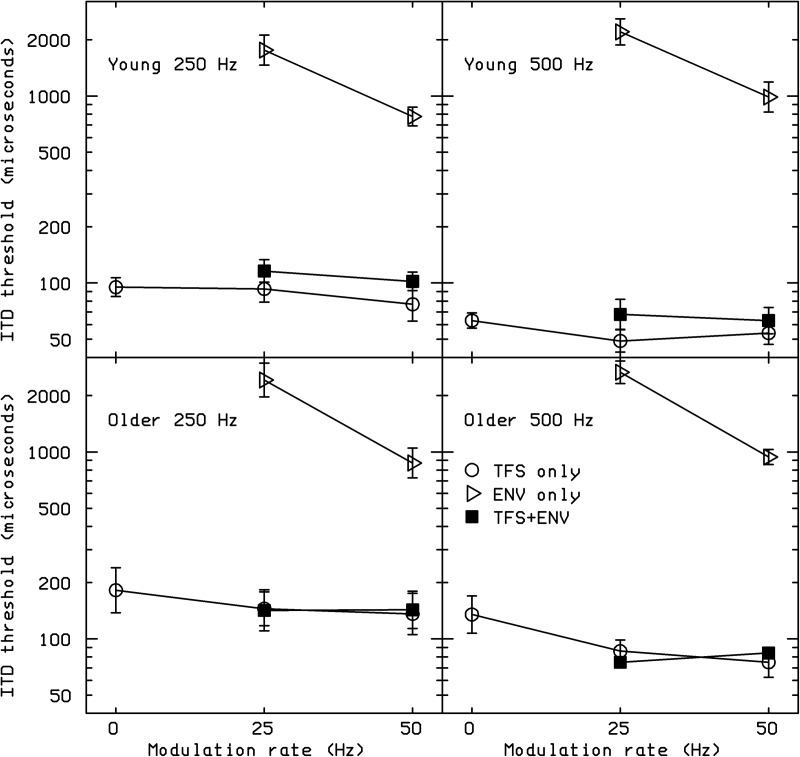
FIG. 2.
Results of experiment 1 showing thresholds (μs) for detecting changes in ITD relative to an ITD of 0 in the following conditions: ITD in the TFS of pure tones (leftmost open circle in each panel), with synchronous envelopes at the two ears; ITD in the TFS of AM tones with AM rates of 25 and 50 Hz with synchronous envelopes at the two ears (middle and right open circles in each panel); ITD in the ENV of AM tones with in-phase TFS at the two ears (open triangles); and ITD in both TFS and ENV (filled squares). The left and right panels are for carrier frequencies of 250 and 500 Hz, respectively. The upper and lower panels are for young and older subjects, respectively. The error bars show ±1 standard error.

