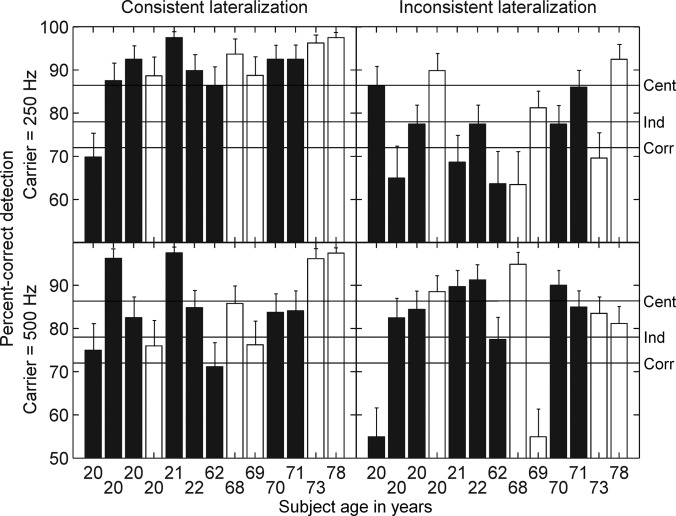
FIG. 4.
Percent correct scores for each subject for the conditions in which equally detectable ITDs in TFS and ENV (71% correct, d′ = 0.78) were combined either in a consistent manner (left panels) or an inconsistent manner (right panels). Error bars indicate the upper end of the 90% confidence interval around the mean. Subjects are ordered by age from left to right, and their data are presented in the same order as for Table I. Black bars and open bars indicate, respectively, subjects with normal hearing and subjects with high-frequency hearing loss but normal hearing at the test frequencies of 250 Hz (top) and 500 Hz (bottom). The lowest horizontal line in each panel shows the score that would be obtained if the internal noise that limited performance was highly correlated for ITDTFS and ITDENV, or if only one of the two cues was used (model Corr). The middle horizontal line shows the score that would be obtained if the internal noise that limited the use of ITDTFS and ITDENV was independent for the two cues and evidence from the two cues was combined optimally (model Ind). The top horizontal line shows the score that would be obtained if the internal noise that limited performance occurred after information from the two cues had been combined (model Cent). Scores falling above this line indicate super-additivity.

