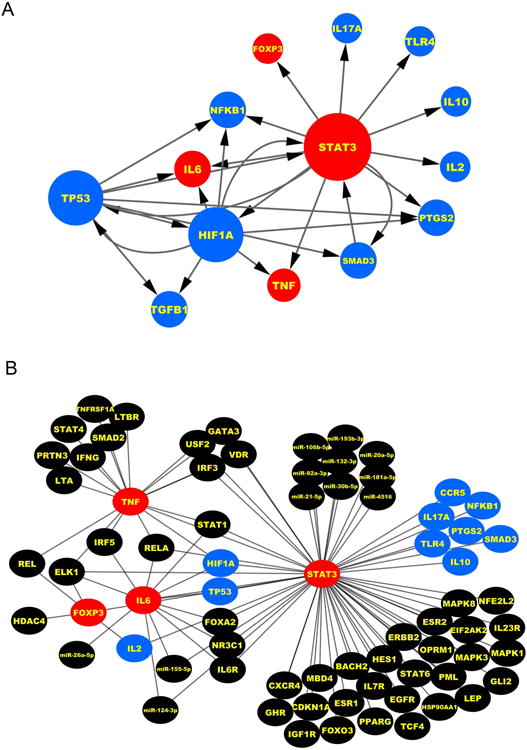
Figure 6. Connectome for the cholangiopathy subcore genes and STAT3, IL6, TNF and FOXP3 centered network.

(A) Regulatory network of subcore genes and grey edges indicating regulatory interaction obtain from transcription factor-miRNA co-regulatory network. The size of the nodes is proportional to the number of edges connected to the node. Red represents the key genes; Blue represents the genes most shared among the cholangiopathies. (B) Network linking STAT3, IL6, TNF and FOXP3 with cholangiopathy-associated genes and miRNAs. Red nodes: key genes; blue nodes: genes shared by three diseases; black nodes: genes/miRNAs for individual disease or shared by two diseases.
