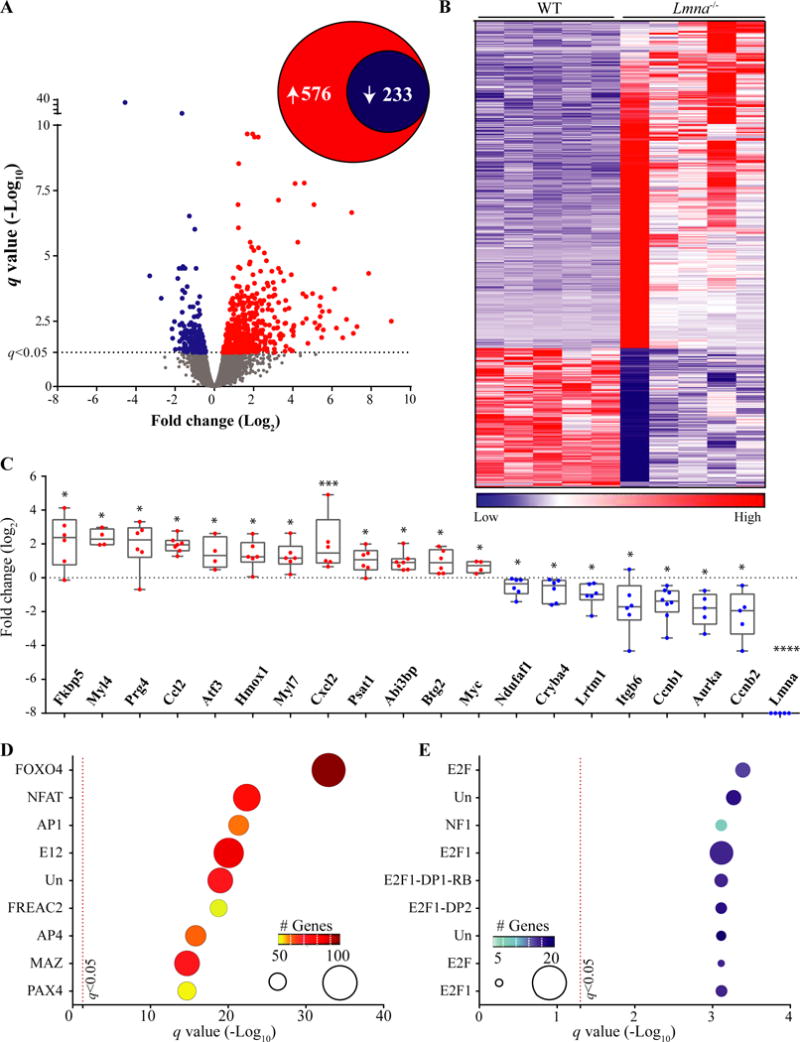
Figure 1. Cardiac RNA-Seq data in 2-week old WT and Lmna−/− mice.

A. Volcano plot of all the transcripts detected by RNA-Seq. The significance level for the differentially expressed transcripts (DETs) is marked by a dashed line at the q value of 0.05. A total of 809 transcripts were differentially expressed between Lmna−/− and WT, comprised of 576 upregulated and 233 down-regulated transcripts (insert circles). B. Heat-map of the DETs. Transcripts were ranked, according to their differential expression across genotypes, from the most up-regulated genes to the most down-regulated in Lmna−/− hearts. C. Quantitative PCR validation of RNA-Seq data for twenty DETs, including Lmna, the latter as a control. The transcripts were randomly selected for validation among those showing about a 2-fold or higher change in RNA-Seq data and were differentially expressed at a q value of 0.05. Gene expression in Lmna−/− after normalization is presented here as Log2 of fold change relative to the expression levels in WT mice *: p<0.05, **: p<0.01, ***: p<0.001, ****: p<0.0001 D and E: Enrichment of conserved cis-regulatory motifs in DETs. DETs were analyzed using GSEA and the MSigDB for enrichment of transcription factor (TF) binding motifs by hypergeometric distribution. Top ten over-represented TFs among the up- (D) and down-regulated (E) TFs are presented. The number of the genes in the overlap is displayed by size of the ball on the graph along with the color coding indicated in the insert. Un: Unknown TF for the identified binding motif. Detailed analysis is provided in Online Table III.
