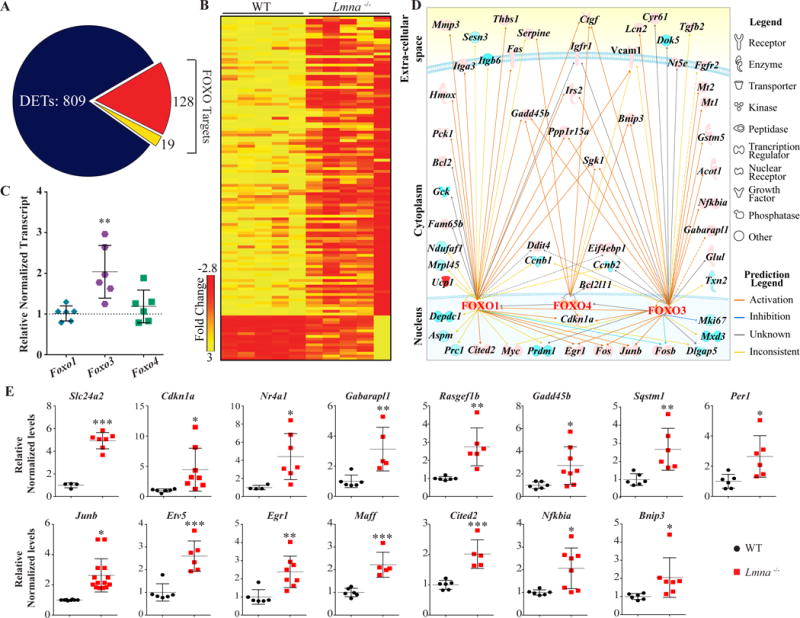
Figure 2. Activation of FOXO transcription factors in Lmna−/− mice at 2 weeks of age.

A. Pie-chart showing the fraction of DETs that are targets of FOXO TFs. A total of 128 targets out of 809 DETs were upregulated and 19 were down-regulated, as highlighted in red and yellow colors, respectively. B. Heat map of the DETs that are targets of the FOXO TFs shown in the WT and Lmna−/− mice. Heat-map colors (red, up-regulation; yellow, down-regulation) indicate transcript fold change obtained from the RNA-Seq data. The scale bar represents magnitude of the change. C. Transcript levels of Foxo1, Foxo3, and Foxo4 in the WT and Lmna−/− mouse hearts, as quantified by qPCR. Among the three isoforms, Foxo3 transcript levels were increased by 2.03±0.49–fold, as compared to WT mice (N=6, p=0.003). D. Upstream regulatory pathways altered in the heart in 2-week old Lmna−/− mice. Ingenuity Pathway Analysis (IPA) of DETs identified FOXO3 transcription factor among the most activated pathway (z-score: 3.75), as reflected in the increased transcript levels of more than 100 target genes. Interactive networks depicting increased (orange) or suppressed (blue) targets of FOXO1, 3 and 4 TFs. Solid and dashed lines represent direct and indirect interactions, respectively. The grey lines indicate predicted interactions without indication of the nature of the relationship, and the yellow interactions with opposite effects from the literature. E. Validation of the RNA-Seq data of FOXO TF targets by qPCR. Relative transcript levels (normalized to Gapdh) of over a dozen FOXO TF target genes, identified by GSEA and IPA analyses, in the Lmna−/− mouse hearts are depicted (N-6-8 mice per group). The findings are concordant with increased transcript levels in the RNA-Seq data.
