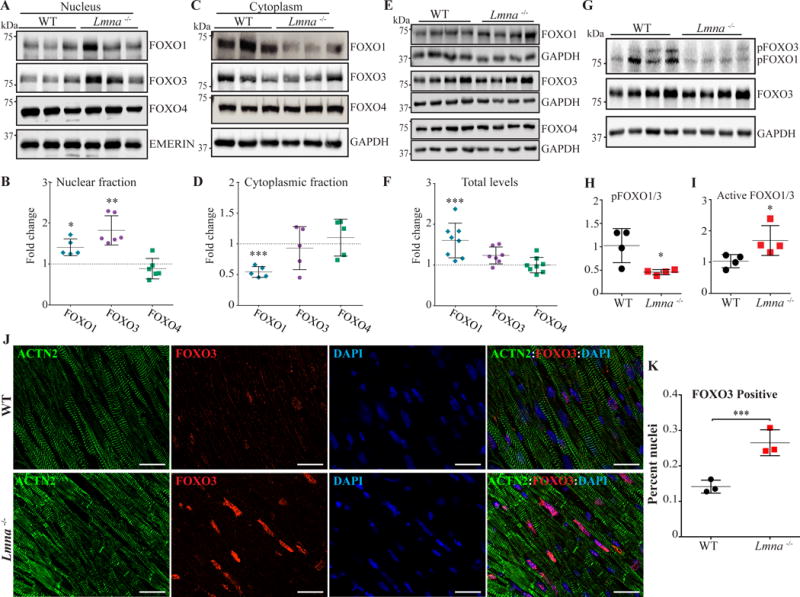
Figure 3. Increased nuclear localization of FOXO transcription factors in cardiac myocytes in the Lmna−/− mice at 2 weeks of age.

A-B. Sub-cellular localization of FOXO TFs in the heart. FOXO1, 3 and 4 proteins were detected by immunoblotting on nuclear and cytoplasmic protein fractions, as well as in the total myocardial proteins extracts from the Lmna−/− and WT mouse hearts (Panels E-F). Corresponding quantitative data show increased levels of FOXO3 in the nuclear protein sub-fraction by 1.8±0.14-fold (Panel B, N=6, p=0.014 vs WT). FOXO1 levels also showed a modest increase in the nuclear protein extracts in the Lmna−/− mouse heart (1.4±0.1 -fold, p=0.035), whereas FOXO4 levels were unchanged (Panel B). Level of FOXO1 in the cytoplasmic protein fraction was reduced by 46.0±3.9% (N=5, p=0.002 vs. WT), whereas levels of FOXO3 and FOXO4 were unchanged (panel C). A modest increase in levels of FOXO1 protein in the total myocardial protein extract (1.6±0.2 -fold vs. WT, N=8-9, p=0.0007) was also noted. There were no significant differences in levels of FOXO3 and FOXO4 in the total myocardial protein extracts between the groups (Panel E and F).
G-H. Immunoblot of phospho-Thr24,32-FOXO1 and 3 (pFOXO1/3), total FOXO1 and 3, and GAPDH, the latter as a loading control. Levels of pFOXO1 and 3 were reduced by 63.4±2.6% in the Lmna−/− mouse hearts (N=4, p=0.028 vs. WT, Panel G and H). Conversely, the estimated active to inactive FOXO1 and 3 levels (total FOXO1/3- pFOXO1/3), were increased by 2.76±0.62 fold in Lmna−/− mouse hearts (p=0.038 vs. WT, panel I). J-K. Representative immunofluorescence staining of FOXO3 and α-actinin (ACTN2), a myocyte marker, on thin myocardial section showing increased nuclear localization of FOXO3 in cardiac myocytes in the Lmna−/− mouse hearts compared to the WT (N=3, scale bar is 20 μm, panel J). Corresponding quantitative data, based on analysis of a minimum of 21820 nuclei per group, is shown in panel K (0.26 ± 0.02 % vs. 0.14 ± 0.01% myocytes in the Lmna−/− and WT mouse hearts, respectively, p=0.006). *: p<0.05, **: p<0.01, ***: p<0.001, ****: p<0.0001
