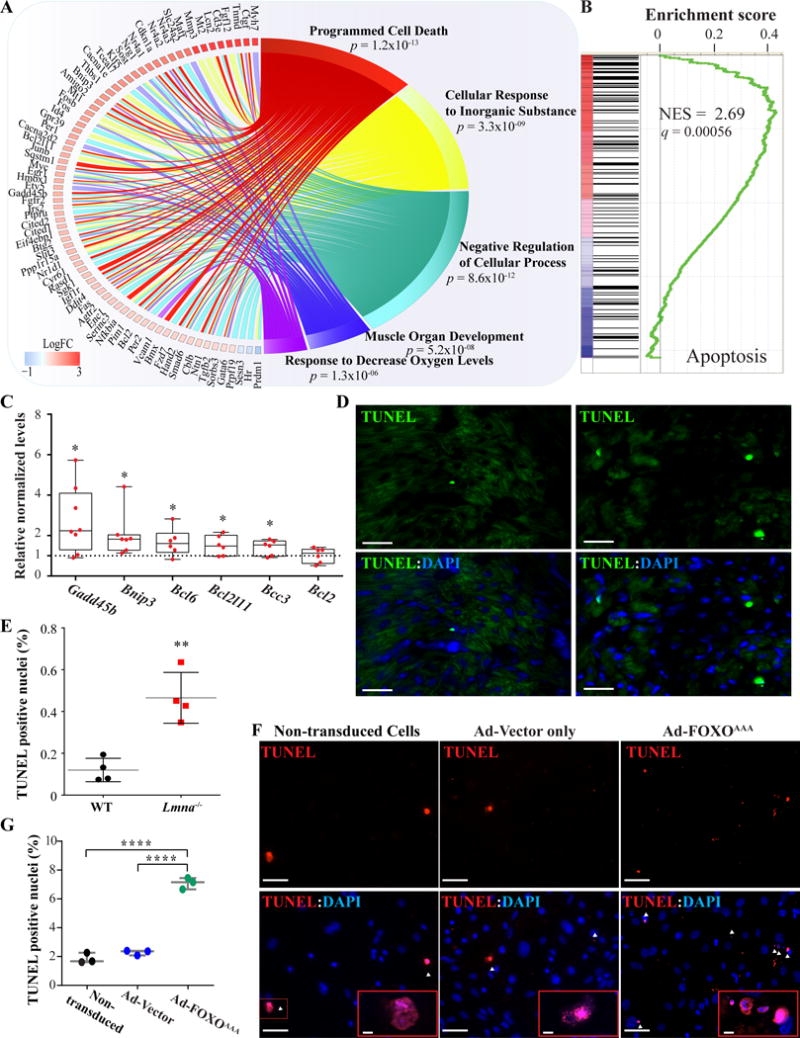
Figure 5. Activated biological pathways in the Lmna−/− mouse hearts.

A. Circos plot depicting the top 5 enriched biological pathways associated with the differentially expressed FOXO TF target genes, as identified by Gene Ontology (GO) analysis and then compiled by relative similarity using Revigo. Expression level of genes involved in the pathway is indicated in log2 of fold change. As shown, programmed cell death (apoptosis) was the most dysregulated biological process. B. GSEA plot showing enrichment of genes involved in apoptosis. C. Quantitative RT-PCR showing increased transcript levels of selected genes involved in the apoptosis process. D-E. Apoptosis staining by TUNEL labeling of thin myocardial sections and the corresponding quantitative data showing increased number of TUNEL (green) positive DAPI-stained nuclei (blue) in the Lmna−/− mouse hearts by 3.8 ±0.5-fold (N=4, p=0.002 vs. WT). Scale bar is 10 μm F- G. TUNEL assay of mouse neonatal ventricular myocytes (mNVM) after infection with adenoviruses expressing a constitutively active form of FOXO3 (Ad-FOXO3AAA) and corresponding quantitative data showing an increased number of TUNEL (red) positive DAPI-stained nuclei (blue) compared to control adenovirus (N=3, 3.1 ± 0.1-fold, p<0.0001) or cell not infected (N=3, 3.8 ± 0.1-fold, p<0.0001). No significant changes in the number of TUNEL positive nuclei between the mNVM infected with the control adenovirus and the cells not infected (2.3 ± 0.1% vs 1.8 ± 0.2%, p=0.3). Scale bar is 50 μm and 5 μm in the insert.
