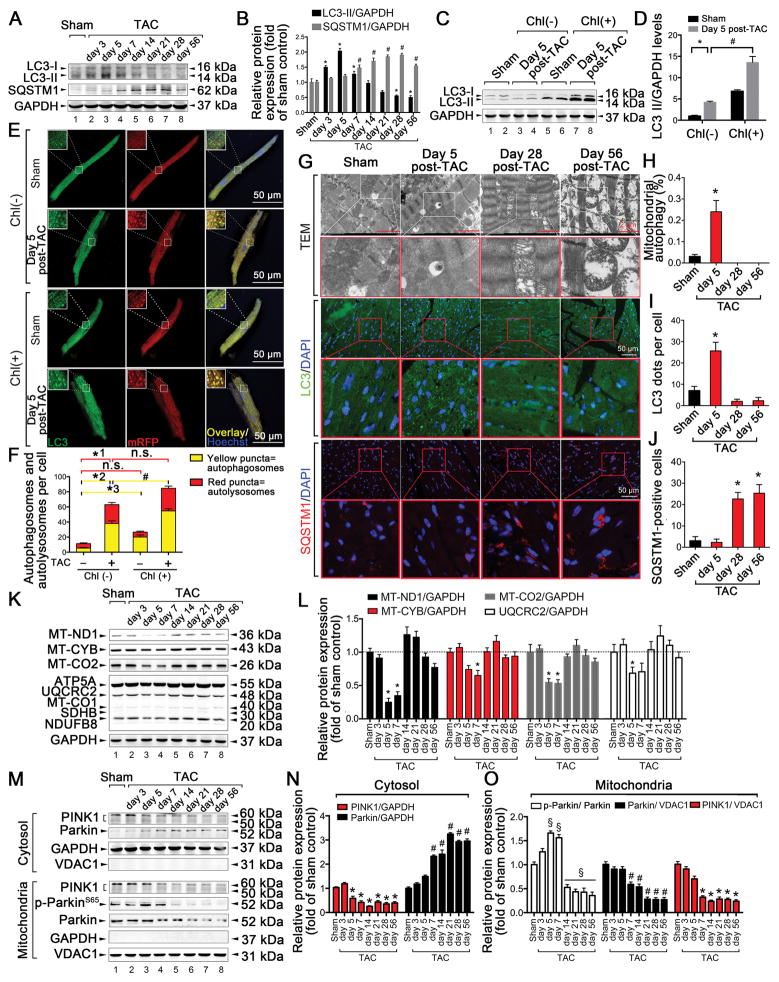
Figure 2. Cardiac general autophagy and mitophagy are transiently increased during the early phase of TAC-induced HF but are downregulated during the chronic phase.
C57BL/6J mice were subjected to either sham operation (n = 20) or TAC and observed after 3, 5, 7, 14, 21, 28, or 56 days (n = 9, 10, 12, 10, 9, 11, or 12, respectively). A–B. Representative immunoblots and quantitative analysis of whole-cell heart homogenates for light chain 3 (LC3) and sequestosome-1 (SQSTM1) are shown. For LC3-II: *P < 0.05 vs. sham-operated mice. For SQSTM1: #P < 0.05 vs. sham-operated mice. C–D. Representative immunoblots and quantitative analysis of whole-cell heart homogenates for LC3 and GAPDH in the presence of chloroquine (chl). E. C57BL/6J mice were subjected to either sham operation (n = 8) or 5 days post-TAC (n = 6) in the presence or absence of intraperitoneally injected chl (10 mg/kg). Representative confocal images of mRFP-GFP-LC3 puncta in primary isolated adult mouse cardiomyocytes (CMs) are shown. Scale bar, 50 μm. F. Bar graph shows the mean number of autophagosomes (yellow dots) and autolysosomes (red dots) per cell. *1P < 0.05, *2P < 0.05, *3P < 0.05 vs. sham-operated mice; #P < 0.05 vs. 5-day TAC-operated mice without chl. G. Representative images from transmission electron microscopy (TEM) and showing fluorescence staining of LC3 and SQSTM1 after sham operation (n = 5) or TAC for 5, 28, or 56 days (n = 5, 6, or 5, respectively). H. Bar graphs indicate the number of autophagosomes containing mitochondria per total number of mitochondria from a cross-sectional assessment of the heart tissues in TEM. *P < 0.05 vs. sham group. I. Autophagy was quantified by counting the green LC3 puncta in CMs. *P < 0.05 vs. sham group. J. Number of SQSTM1-positive CMs is shown. *P < 0.05 vs. sham group. K-L. Representative immunoblots and quantitative analysis of MT-ND1, MT-CYB, MT-CO2, and electron transport chain (ETC) complexes in whole-cell heart homogenates. *P < 0.05 vs. sham group. M. Top, representative immunoblots of PINK1 and Parkin in the cytosolic fraction prepared from heart homogenates; Bottom, representative immunoblots of PINK1, p-Parkin S65, and Parkin in the mitochondrial fraction prepared from heart homogenates. N. Quantitative analysis of PINK1 and Parkin in the cytosolic fraction. For PINK1: *P < 0.05 vs. sham group; For Parkin: #P < 0.05 vs. sham group. O. Quantitative analysis of p-Parkin S65/Parkin, PINK1, and Parkin in the mitochondrial fraction. For PINK1: *P < 0.05 vs. sham group; For Parkin: #P < 0.05 vs. sham group. §P < 0.05 vs. sham group. All data represent the mean ± SEM from at least four independent experiments.

