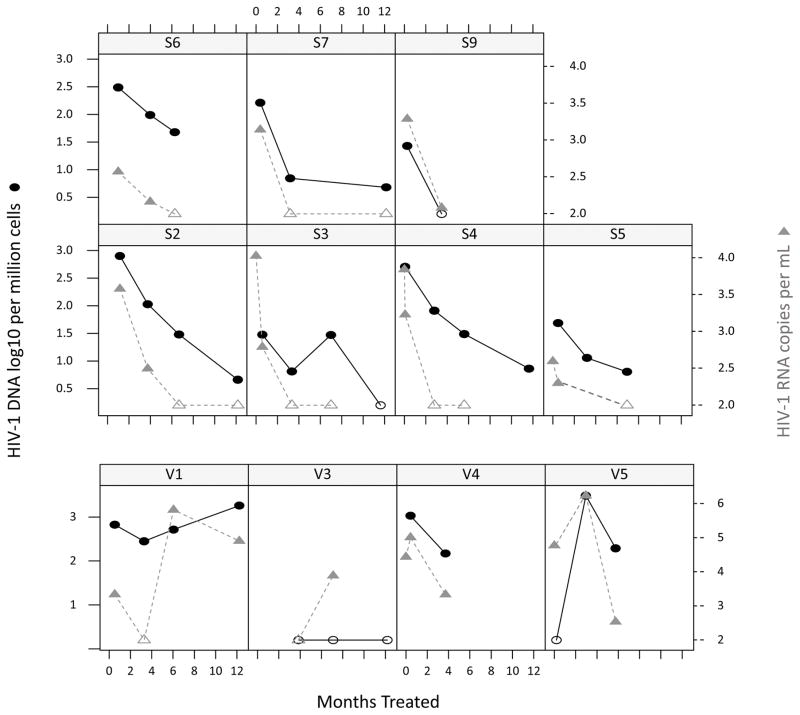
Figure.
Infants who had assay detectable cell associated HIV-1 DNA before or at treatment initiation were included. As only dried blood samples (DBS) were available from pre-treatment, which contain cells other than peripheral blood mononuclear cells (PBMC), HIV-1 cell associated DNA results shown in this figure were all from PBMCs collected after treatment initiation. HIV-1 DNA (black circles) copies/million cells and plasma HIV-1 RNA (grey triangles) copies/mL were assessed in 11 patients. “S” denotes those suppressed and “V” those viremic. Open icons indicate HIV-1 DNA or plasma RNA below the limit of detection: plasma HIV-1 RNA was censored at < 100 copies per mL and HIV-1 DNA loads at < 3 copies/million peripheral blood mononuclear cells (PBMCs). All suppressed infants except S6 reached an HIV-1 DNA level < 10 copies/million PBMCs. S9 had HIV-1 DNA declining to undetectable at 3.5 months. The decay slope of suppressed individuals had a conditional R2 (95% CI) of 0.77(0.53–0.91); Mean t ½ (95% CI): 64.8 (47.9–105.7) days. V3 had a visit at 1.5 months on ART for which no blood sample was received, thereafter at 3.8 months HIV-1 DNA was undetectable. V5 had undetectable HIV-1 DNA at the first on-ART visit but had viremia detected subsequently. HIV-1 DNA levels increased in V1 and V5.

