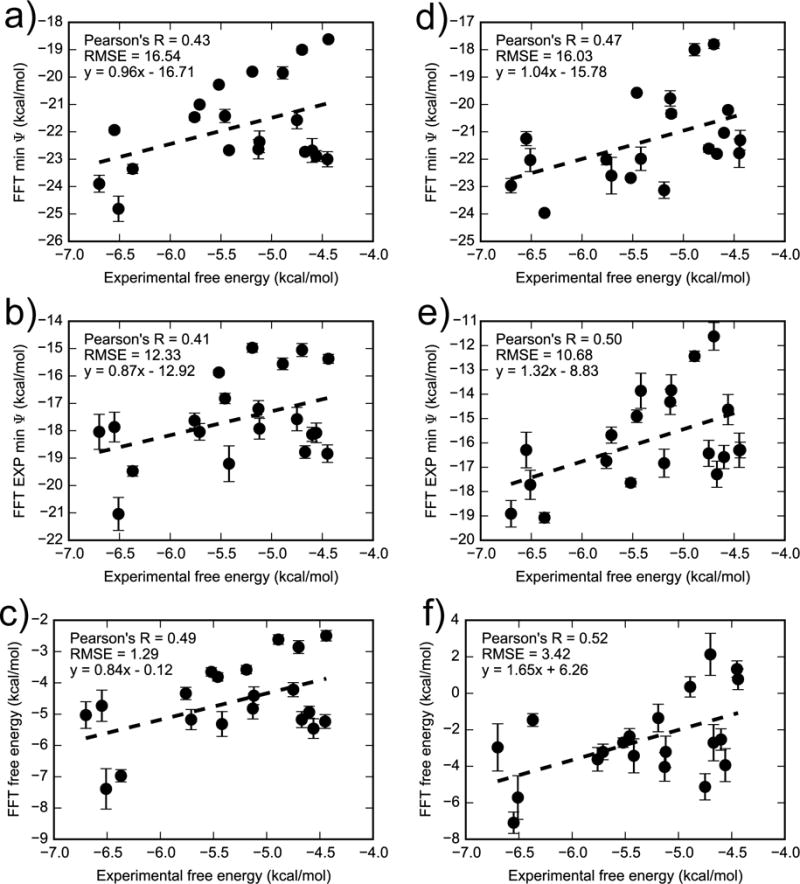
Figure 11.

Comparing FFT free energy calculations in (a–c) OBC2 and (d–f) PBSA implicit solvent with experiment for 20 ligands excluding iodobenzene. The top row are minimum interaction energies for all receptor snapshots, middle row are the exponential average of the interaction energies, and bottom row are the full FFTΔG estimate. Note that each set of axes have different limits. Figure S7 in the supplementary material is similar but includes the outlier iodobenzene.
