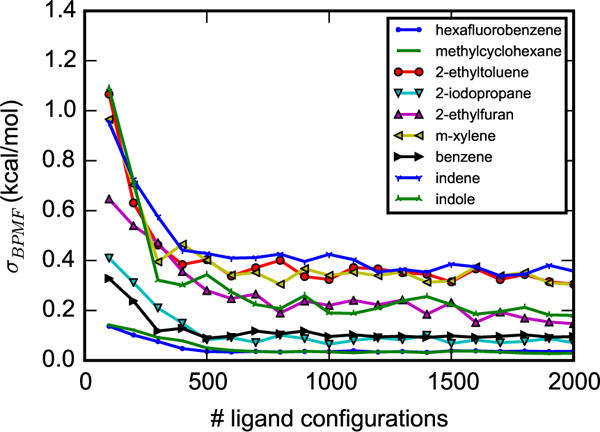
Figure 5.

Convergence of BPMF calculations. Standard deviations (σBPMF) of BPMF calculations as a function of the number of ligand configurations, shown for nine arbitrarily chosen ligands. σBPMF are obtained by repeating the BPMF calculations 10 times, using different sets of ligand configurations. Figures S1 and S2 in the supplementary material show the bootstrapping estimate of σBPMF for all 141 ligands.
