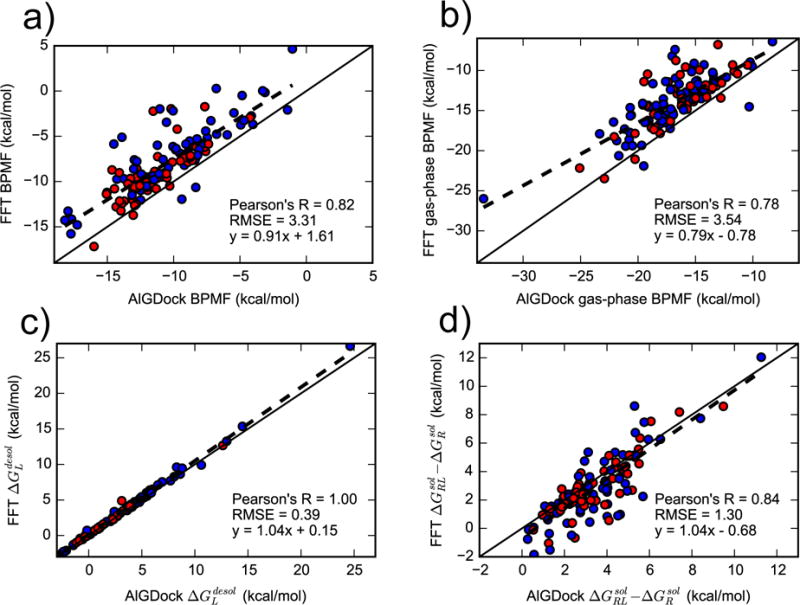
Figure 6.

Comparing contributions to the BPMF from AlGDock (x-axis) and FFTΔG (y-axis). Contributions are for the (a) total BPMF in GBSA implicit solvent, (b) gas-phase BPMF, (c) ligand desolvation free energy, and (d) the difference between the complex and receptor solvation free energy. Active and inactive molecules are shown with red and blue markers, respectively.
