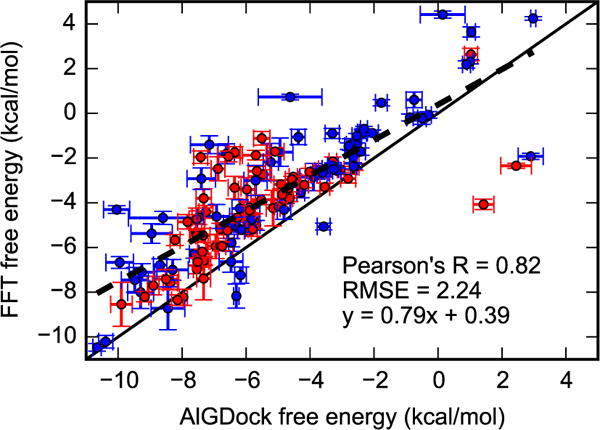
Figure 9.

Binding free energies for 140 ligands estimated using AlGDock33 (x-axis) and FFT (y-axis) using weighting scheme (c). For FFT calculations, the grid spacing was 0.125 Å and grid size was 16 Å cubed, encompassing only the binding pocket. Active and inactive molecules are shown with red and blue markers, respectively. Error bars denote the standard deviation from bootstrapping BPMFs, with the range of error bars representing a single standard deviation. The solid line is y = x and the dashed line is the linear regression line. One ligand with high free energies, 1,2-benzenedithiol, is excluded from this plot but is included in Figure S5 in the supplementary material.
