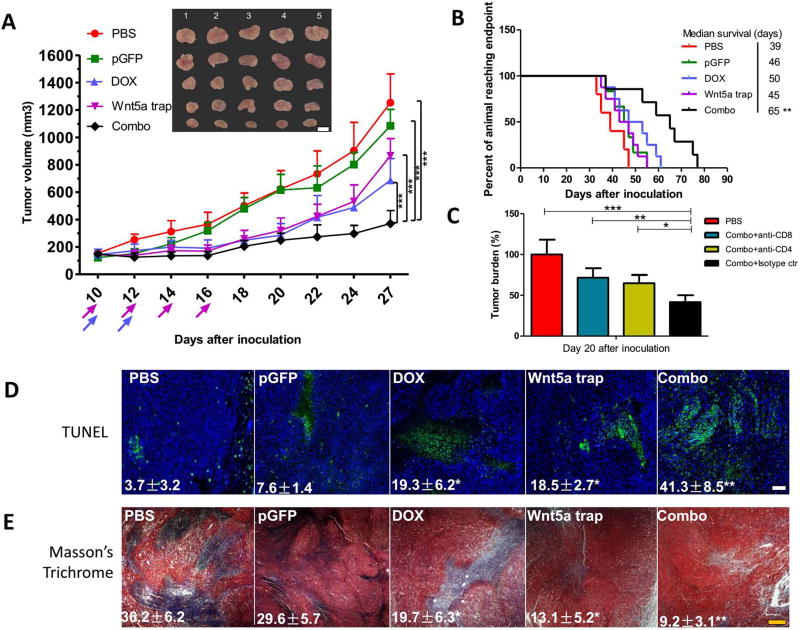
Figure 4. Combination therapy significantly inhibited tumor progression.
(A) Tumor inhibition of combination therapy, compared with untreated or monotherapy groups. n = 8. (B) Long term survival monitored over two months. n = 8–10. (C) Tumor bearing mice were pretreated with 3 daily injections of anti-CD8 and/or anti-CD4 antibody (300 µg/mice) to deplete the CD8+ and/or CD4+ T cells in vivo. Isotype IgG was used as control. The efficacy of combination therapy with or without different T cell depletion was compared by monitoring tumor burden after treatment cycles. n = 5. (D) TUNEL assay depicting apoptotic region within tumor slide sections. n = 3. (E) Masson’s trichrome staining depicting collagen distribution within TME. n = 3. Scale bars indicate 300 µm. *: p < 0.05, **: p < 0. 01, ***: p < 0. 001.

