Figure 3.
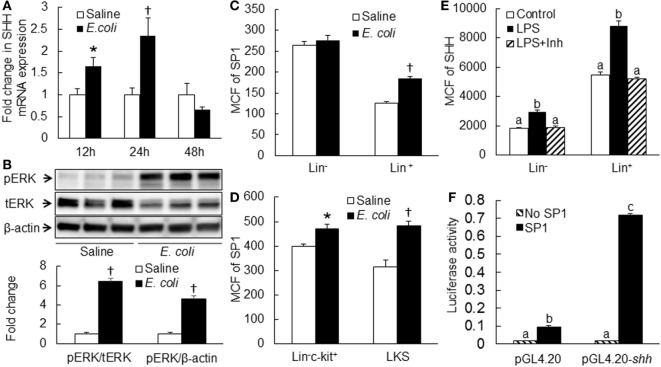
(A) Changes in Sonic hedgehog (SHH) mRNA expression by bone marrow cells (BMCs) following systemic E. coli infection. Saline: i.v. injection of saline; E. coli: i.v. injection of E. coli. Data are mean ± SEM. N = 4–9. *p < 0.05 compared to Saline group; †p < 0.01 compared to Saline group. (B) Activation of ERK1/2 in BMCs at 8 h of systemic E. coli infection. Saline: i.v. injection of saline; E. coli: i.v. injection of E. coli; pERK: phospho-ERK1/2; tERK: total ERK1/2. Data in the bar figure panel are mean ± SEM. n = 5. † p < 0.01 compared to Saline group. (C,D) Changes in SP1 expression by BMCs at 18 h of systemic E. coli infection. Saline: i.v. injection of saline; E. coli: i.v. injection of E. coli; MCF: mean channel fluorescent intensity. Data are mean ± SEM. N = 5. *p < 0.05 compared to Saline group; †p < 0.01 compared to Saline group. (E) Block of lipopolysaccharide (LPS)-induced SHH expression by BMCs by PD0325901. Control, control cell culture; LPS, LPS stimulation; LPS + Inh, LPS stimulation in the presence of PD0325901. Data are mean ± SEM. N = 5. Bars with different letters in each cell subpopulation are statistically different (p < 0.05). (F) SP1-induced enhancement of shh promoter activity in cultured HEK293 T cells. No SP1: cell transfected with control vector; SP1: cell transfected with SP1 expression vector; pGL4.20: cells transfected with control pGL4.20 promoter reporter vector; pGL4.20-shh: cells transfected with pGL4.20 promoter reporter vector containing murine shh promoter sequence. Data are mean ± SEM. N = 6. *p < 0.05 compared to the corresponding group transfected with control vector without SP1 gene.

