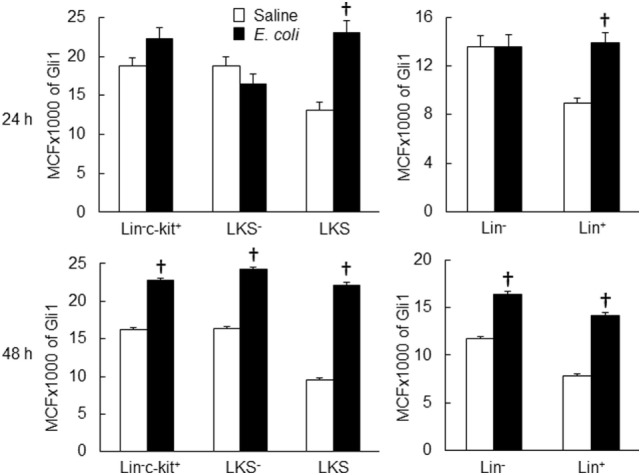
Figure 7.

Changes in mean channel fluorescent intensity (MCF) of Gli1 expression by marrow cell subpopulations 24 and 48 h following systemic E. coli infection. Saline: i.v. injection of saline; E. coli: i.v. injection of E. coli. Data are mean ± SEM. N = 5–7. †p < 0.01 compared to the corresponding Saline group.
