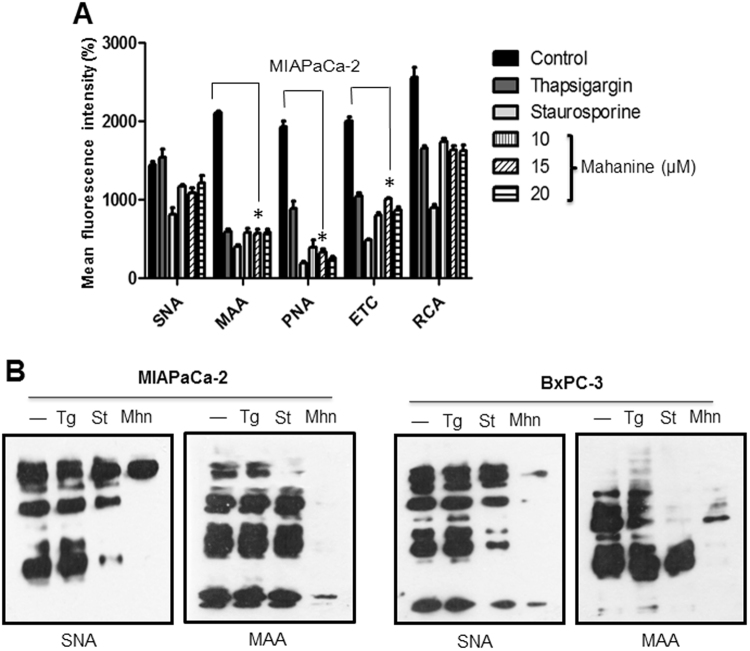
Figure 4.
Reduced glycosylation in mahanine treated-MIAPaCa-2 cells. (A) Cell surface expression of glycans was determined using different lectins by FACS as described in material and methods. Histogram plot of mean fluorescence intensity (MFI) of different lectins binding towards the MIAPaCa-2 cells treated with different doses of mahanine for 18 hr. (B) Evaluation of cellular sialoglycoprotein using two sialic acid binding lectins (SNA and MAA) in the MIAPaCa-2 cells treated with mahanine (Mhn, 20 µM) for 18 hr as described in material and methods. In parallel thapsigargin (Tg, 1.0 µM), staurosporine (St, 1.0 µM) were always used for comparison.

