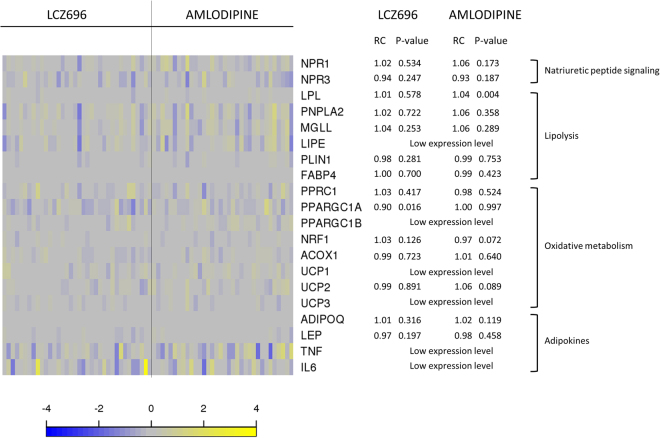
Figure 1.
Targeted assessment of selected treatment-induced transcriptional changes in abdominal subcutaneous adipose tissue. The heatmap plot shows per patient longitudinal treatment-induced gene expression changes [defined as log2(post treatment expression) - log2(pre-treatment expression)] for selected transcripts related to natriuretic peptide signaling, lipolytic pathway, oxidative pathway and adipokines in abdominal subcutaneous adipose tissue (n = 70 patients; grouped per treatment arm). Color in the heatmap reflects transcript change from baseline per subject. Blue: downregulated transcripts; yellow: upregulated transcripts. The adjacent table depicts the corresponding transcript ratio change from baseline (RC) and P-value per treatment arm.

