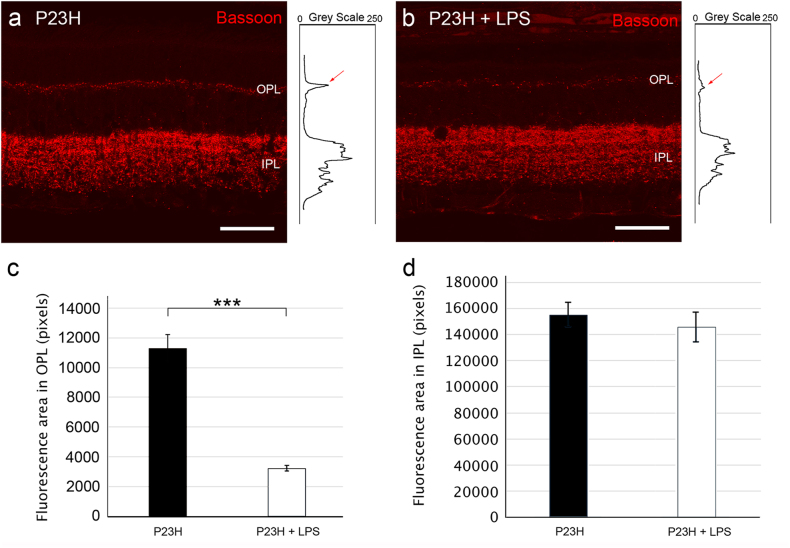
Fig. 5. Effect of LPS on synaptic connectivity.
a, b Representative vertical retinal sections showing synaptic ribbons immunostained with anti-Bassoon antibodies (red) from vehicle-injected a and LPS-injected b P23H rats. Right inserts show the profile plots of mean gray intensity for each horizontal line of images of the retina showing Bassoon immunofluorescence. c, d Quantification of the differential expression of Bassoon in the outer c and the inner plexiform layers d of P23H rats. Data are represented as mean values of fluorescence in areas close to the optic nerve ± SEM, n = 6. ***P < 0.001; ANOVA, Bonferroni’s test. IPL: inner plexiform layer, OPL: outer plexiform layer. Scale bar 40μm.

