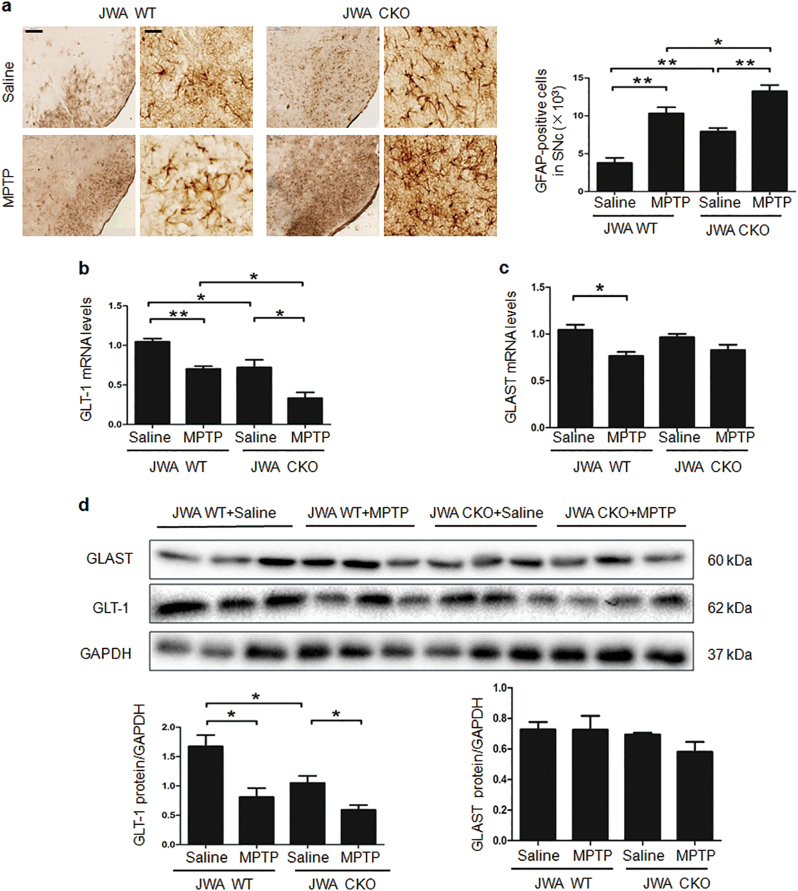
Fig. 3. Astrocytic JWA deficiency induces astrocyte activation and reduced the expression of GLT-1 in vivo.
a Immunohistochemical staining and quantitative data for GFAP-positive neurons in the SNc (n = 4). Scale bars = 200 μm (low magnification) and 50 μm (high magnification). b, c Quantitative real-time PCR analyses for GLT-1 and GLAST are shown in the SNc. GAPDH was used as a control to normalize the differences in the amount of total RNA in each sample (n = 6). d Western blotting and quantification for analysis of GLT-1 and GLAST protein expression in midbrain extracts. GAPDH was used as a loading control to confirm that equal amounts of protein were loaded in each line (n = 7). Data are presented as mean ± SEM, one-way ANOVA, *P < 0.05, **P < 0.01

